29
/es/
es
AIzaSyAYiBZKx7MnpbEhh9jyipgxe19OcubqV5w
April 1, 2024
75445
Azerbaijan
AZE
true
2
1
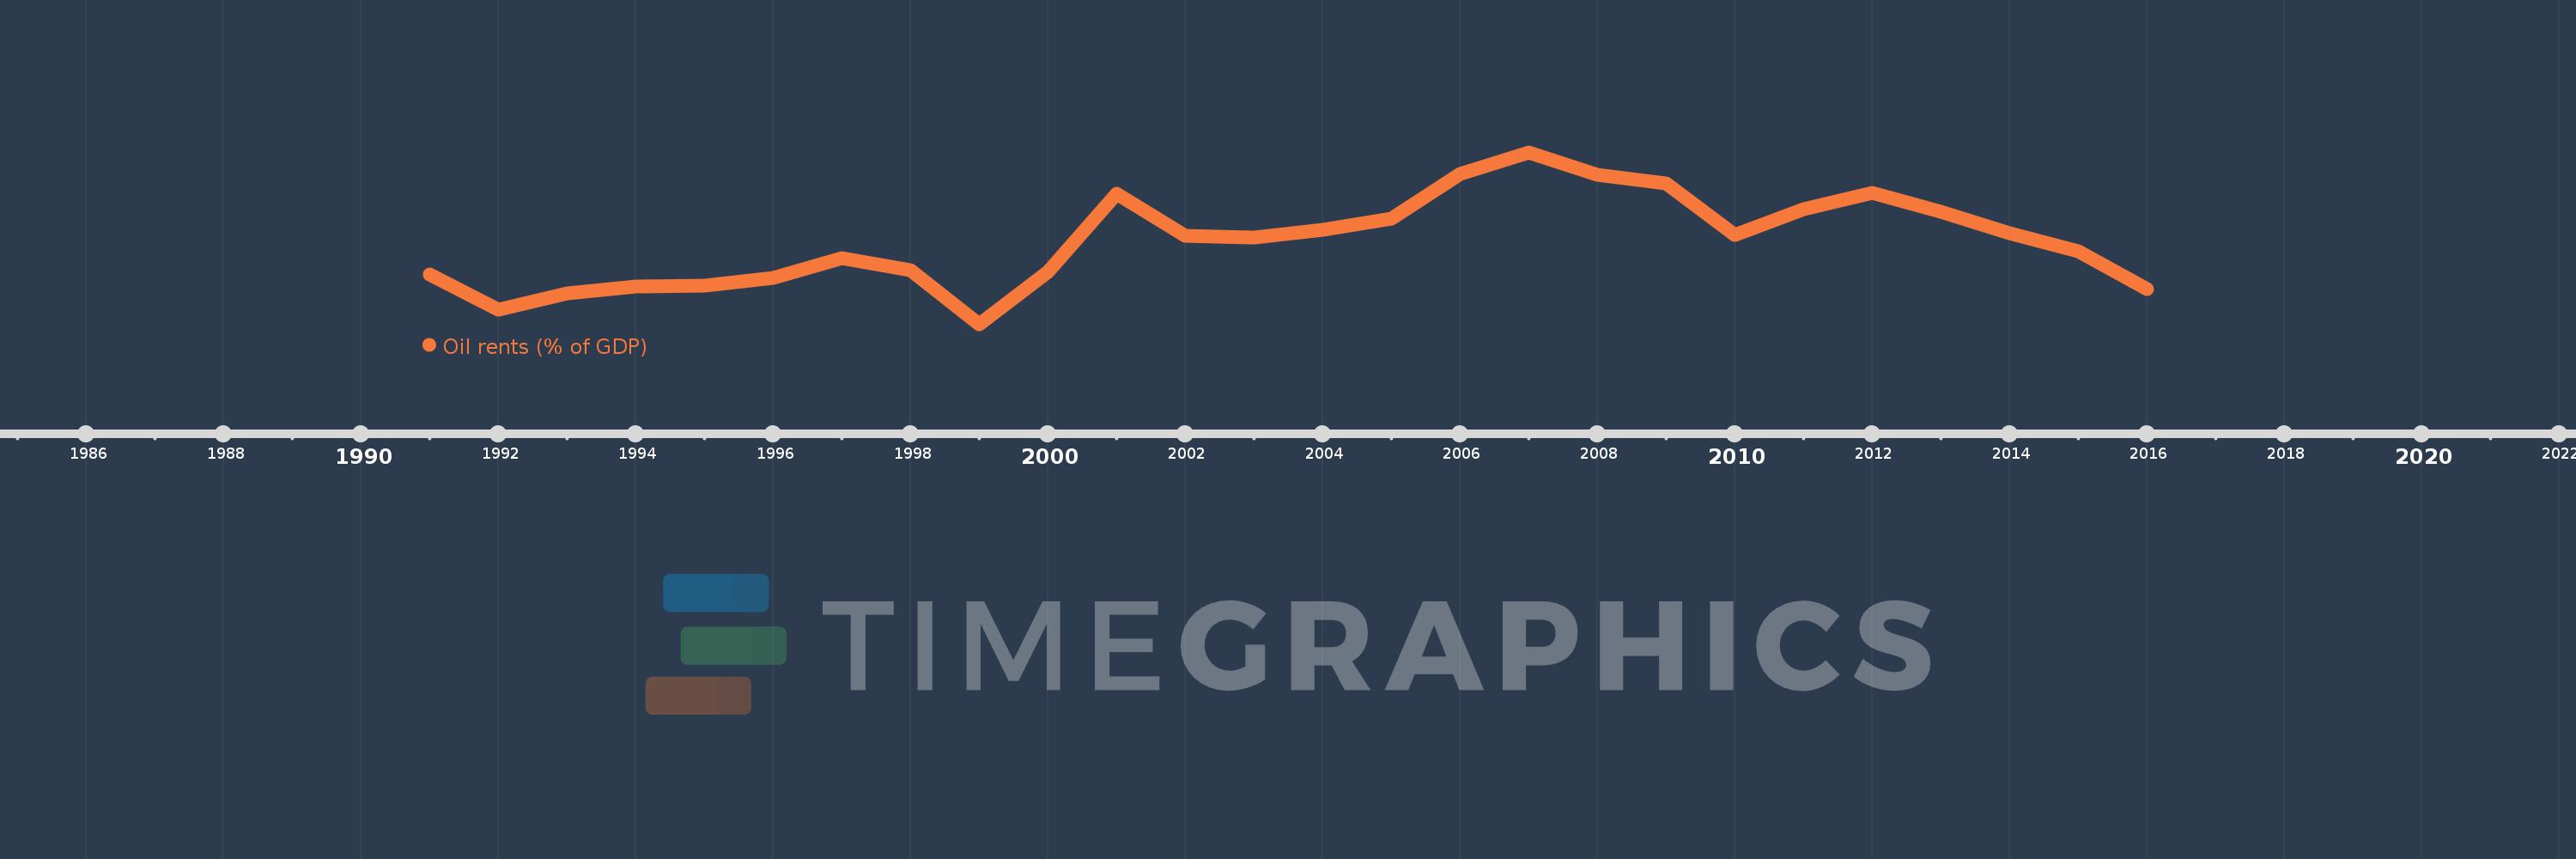
Oil rents (% of GDP)
2016,2015,2014,2013,2012,2011,2010,2009,2008,2007,2006,2005,2004,2003,2002,2001,2000,1999,1998,1997,1996,1995,1994,1993,1992,1991
Estas estadísticas en otros países:
línea de tiempo (timeline):
En esta escala de tiempo se presenta un gráfico de 1991 y 2016 de Azerbaijan. Los datos de 1990 están ausentes. El número de observaciones reales por fecha: 26.
Fuente (nombre):
Indicadores del desarrollo mundial
Fuente (organización):
Estimates based on sources and methods described in "The Changing Wealth of Nations: Measuring Sustainable Development in the New Millennium" (World Bank, 2011).
Categorías:
Energy & Mining, Environment
Se ha actualizado:
23 abr 2017 año
Los indicadores de los cambios de valor en los últimos años
Mínimo:
3.06
1 ene 1999 año
Máximo:
41.707
1 ene 2007 año
A la fecha de observación
Valor
Cambio absoluto
El cambio con respecto al valor anterior
1 ene 1991 año
14.245
+14.245
0.0%
1 ene 1992 año
6.291
-7.954
-55.84%
1 ene 1993 año
9.998
+3.708
58.94%
1 ene 1994 año
11.469
+1.47
14.71%
1 ene 1995 año
11.64
+0.171
1.49%
1 ene 1996 año
13.543
+1.903
16.35%
1 ene 1997 año
17.89
+4.347
32.1%
1 ene 1998 año
15.221
-2.669
-14.92%
1 ene 1999 año
3.06
-12.161
-79.9%
1 ene 2000 año
14.743
+11.683
381.82%
1 ene 2001 año
32.439
+17.696
120.04%
1 ene 2002 año
22.951
-9.488
-29.25%
1 ene 2003 año
22.515
-0.436
-1.9%
1 ene 2004 año
24.389
+1.874
8.33%
1 ene 2005 año
26.832
+2.443
10.02%
1 ene 2006 año
36.814
+9.982
37.2%
1 ene 2007 año
41.707
+4.893
13.29%
1 ene 2008 año
36.595
-5.112
-12.26%
1 ene 2009 año
34.642
-1.953
-5.34%
1 ene 2010 año
23.226
-11.416
-32.95%
1 ene 2011 año
28.996
+5.77
24.84%
1 ene 2012 año
32.684
+3.688
12.72%
1 ene 2013 año
28.44
-4.244
-12.98%
1 ene 2014 año
23.599
-4.841
-17.02%
1 ene 2015 año
19.394
-4.205
-17.82%
1 ene 2016 año
11.001
-8.393
-43.28%
Ranking de los países por los datos estadísticos actuales


Comentarios: