29
/es/
es
AIzaSyAYiBZKx7MnpbEhh9jyipgxe19OcubqV5w
April 1, 2024
53684
Other small states
OSS
false
2
1
Oil rents (% of GDP)
2016,2015,2014,2013,2012,2011,2010,2009,2008,2007,2006,2005,2004,2003,2002,2001,2000,1999,1998,1997,1996,1995,1994,1993,1992,1991,1990,1989,1988,1987,1986,1985,1984,1983,1982,1981,1980,1979,1978,1977,1976,1975,1974,1973,1972
Estas estadísticas en otros países:
línea de tiempo (timeline):
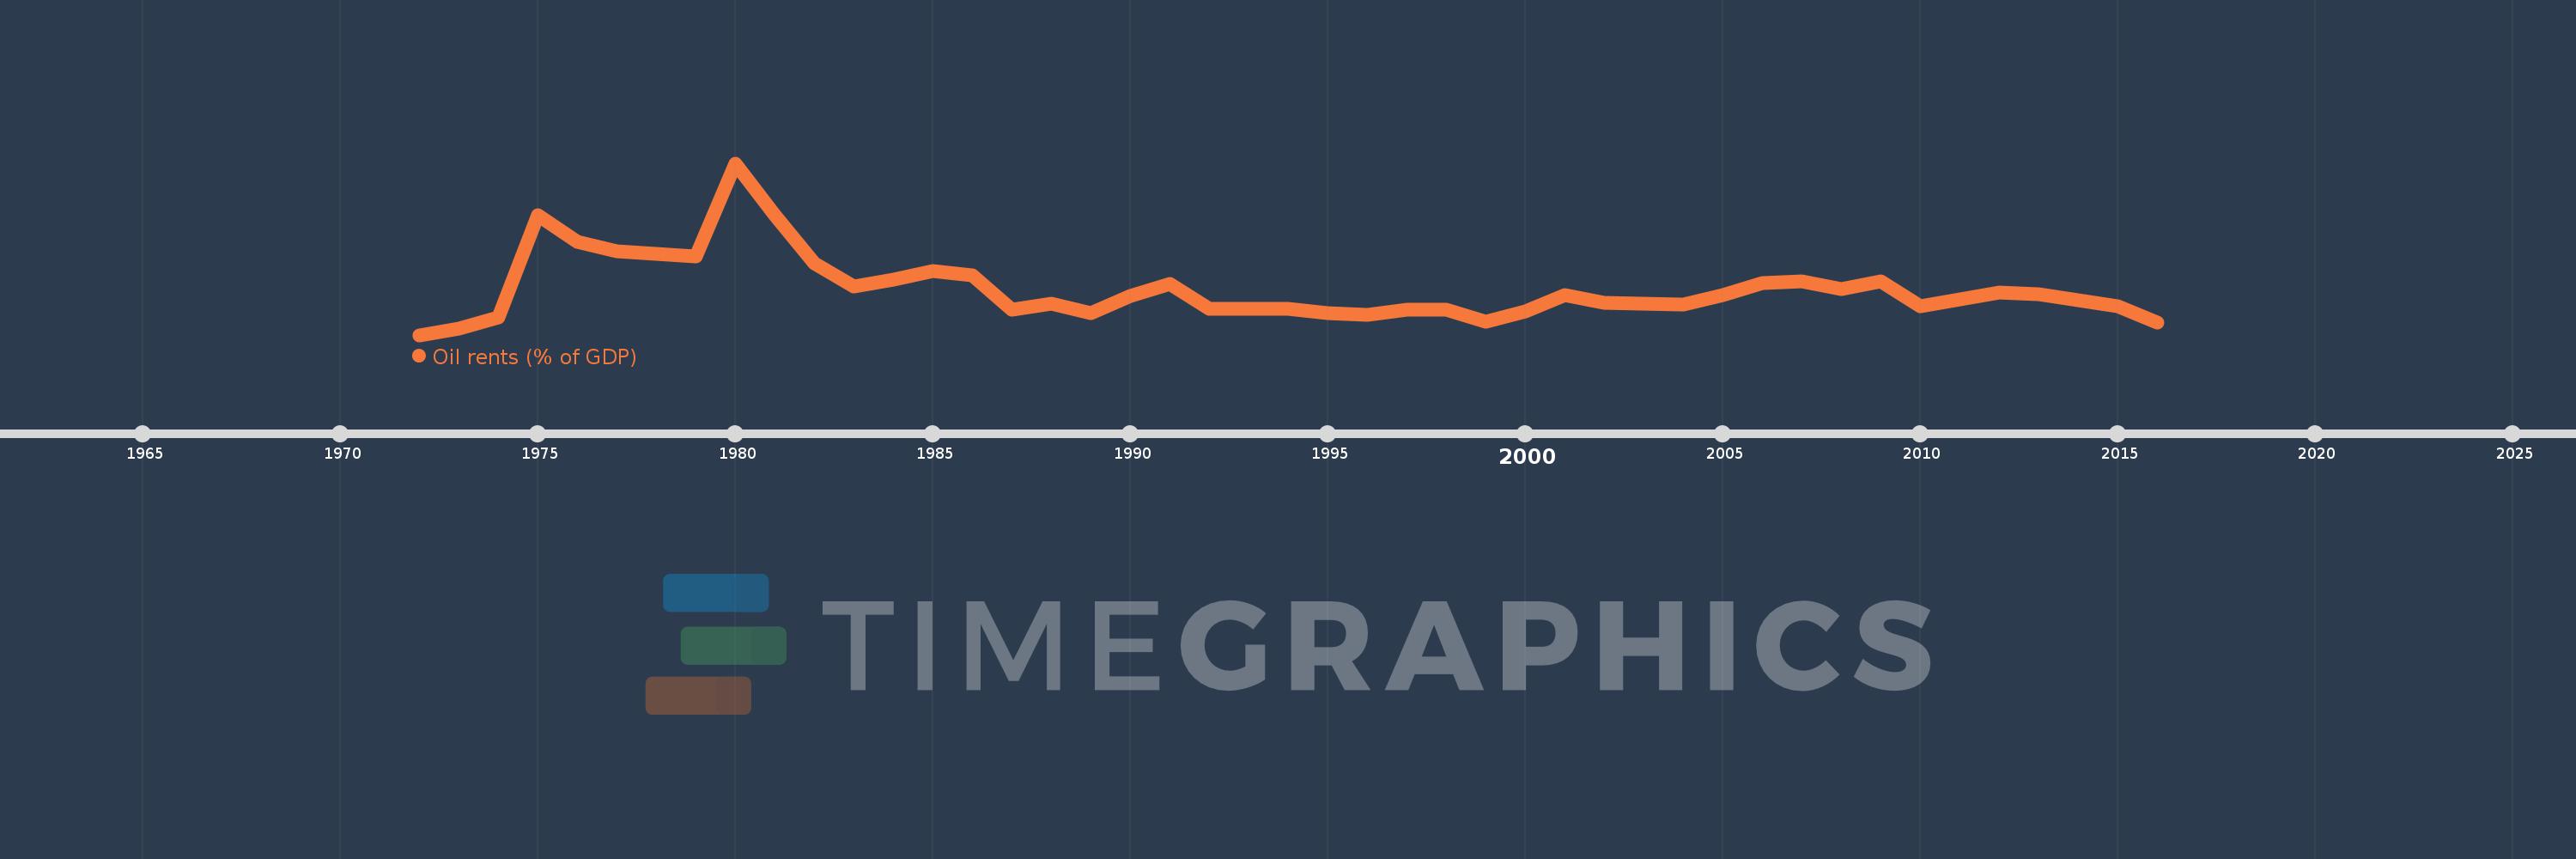
En esta escala de tiempo se presenta un gráfico de 1972 y 2016 de Other small states. Los datos de 1971 están ausentes. El número de observaciones reales por fecha: 45.
Fuente (nombre):
Indicadores del desarrollo mundial
Fuente (organización):
Estimates based on sources and methods described in "The Changing Wealth of Nations: Measuring Sustainable Development in the New Millennium" (World Bank, 2011).
Categorías:
Energy & Mining, Environment
Se ha actualizado:
23 abr 2017 año
Los indicadores de los cambios de valor en los últimos años
Mínimo:
0.761
1 ene 1972 año
Máximo:
48.98
1 ene 1980 año
A la fecha de observación
Valor
Cambio absoluto
El cambio con respecto al valor anterior
1 ene 1972 año
0.761
+0.761
0.0%
1 ene 1973 año
2.661
+1.9
249.83%
1 ene 1974 año
5.642
+2.981
112.04%
1 ene 1975 año
34.468
+28.826
510.95%
1 ene 1976 año
26.865
-7.603
-22.06%
1 ene 1977 año
24.229
-2.636
-9.81%
1 ene 1978 año
23.595
-0.634
-2.62%
1 ene 1979 año
22.88
-0.715
-3.03%
1 ene 1980 año
48.98
+26.1
114.08%
1 ene 1981 año
34.298
-14.682
-29.98%
1 ene 1982 año
20.917
-13.381
-39.01%
1 ene 1983 año
14.466
-6.451
-30.84%
1 ene 1984 año
16.424
+1.958
13.53%
1 ene 1985 año
18.743
+2.319
14.12%
1 ene 1986 año
17.57
-1.173
-6.26%
1 ene 1987 año
7.813
-9.757
-55.53%
1 ene 1988 año
9.523
+1.71
21.89%
1 ene 1989 año
6.917
-2.606
-27.36%
1 ene 1990 año
11.649
+4.732
68.41%
1 ene 1991 año
15.095
+3.446
29.58%
1 ene 1992 año
8.057
-7.038
-46.62%
1 ene 1993 año
8.18
+0.122
1.52%
1 ene 1994 año
8.144
-0.036
-0.44%
1 ene 1995 año
6.988
-1.156
-14.2%
1 ene 1996 año
6.367
-0.621
-8.88%
1 ene 1997 año
7.756
+1.389
21.82%
1 ene 1998 año
7.954
+0.198
2.55%
1 ene 1999 año
4.541
-3.413
-42.91%
1 ene 2000 año
7.282
+2.741
60.35%
1 ene 2001 año
11.951
+4.669
64.11%
1 ene 2002 año
9.83
-2.121
-17.75%
1 ene 2003 año
9.654
-0.176
-1.79%
1 ene 2004 año
9.291
-0.363
-3.76%
1 ene 2005 año
12.021
+2.73
29.39%
1 ene 2006 año
15.384
+3.363
27.98%
1 ene 2007 año
15.916
+0.532
3.46%
1 ene 2008 año
13.642
-2.274
-14.29%
1 ene 2009 año
15.846
+2.204
16.15%
1 ene 2010 año
8.733
-7.113
-44.89%
1 ene 2011 año
10.798
+2.065
23.65%
1 ene 2012 año
12.803
+2.005
18.56%
1 ene 2013 año
12.217
-0.586
-4.58%
1 ene 2014 año
10.571
-1.646
-13.47%
1 ene 2015 año
8.949
-1.623
-15.35%
1 ene 2016 año
4.224
-4.724
-52.79%
Ranking de los países por los datos estadísticos actuales


Comentarios: