29
/es/
es
AIzaSyAYiBZKx7MnpbEhh9jyipgxe19OcubqV5w
April 1, 2024
73601
Austria
AUT
true
2
1
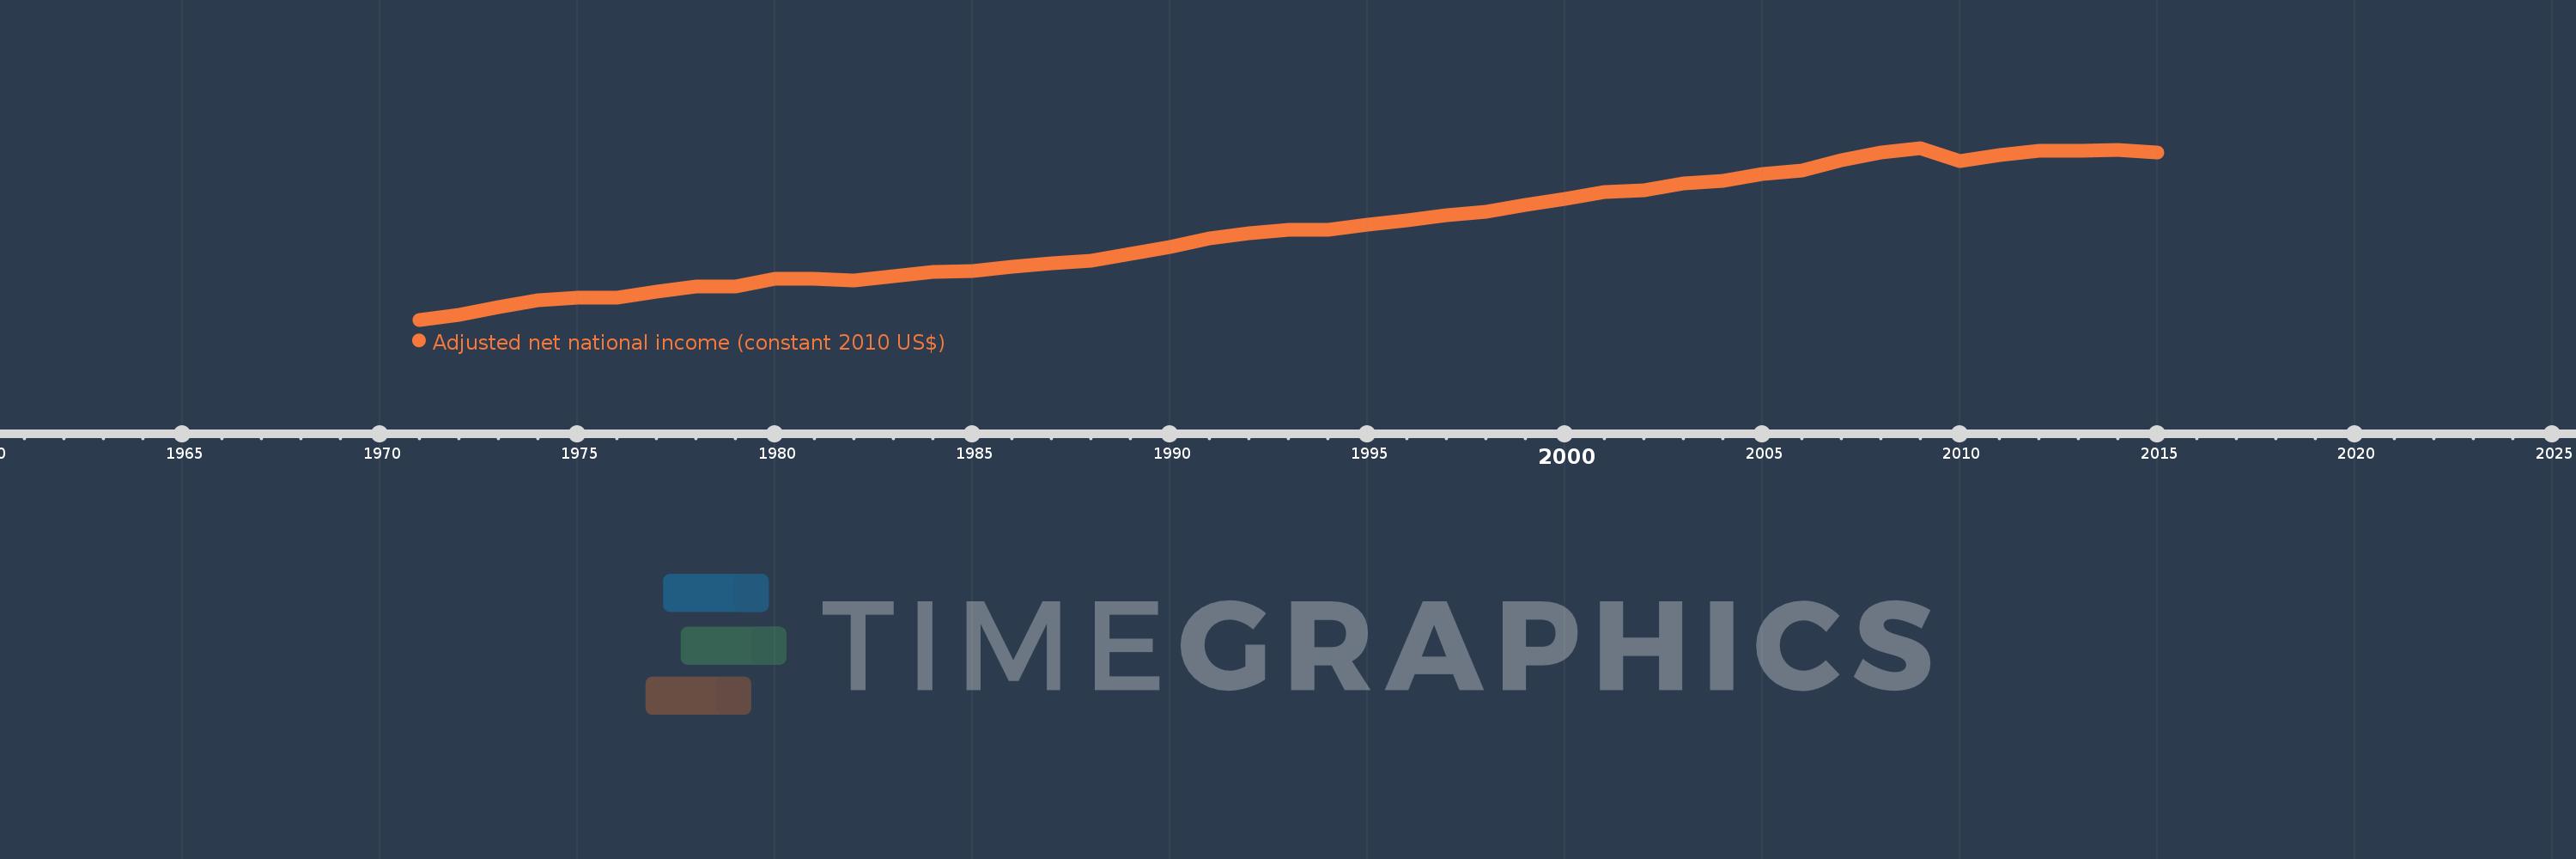
Adjusted net national income (constant 2010 US$)
2015,2014,2013,2012,2011,2010,2009,2008,2007,2006,2005,2004,2003,2002,2001,2000,1999,1998,1997,1996,1995,1994,1993,1992,1991,1990,1989,1988,1987,1986,1985,1984,1983,1982,1981,1980,1979,1978,1977,1976,1975,1974,1973,1972,1971
Estas estadísticas en otros países:
AfghanistanAlbaniaAlgeriaAngolaArab WorldArgentinaArmeniaAustraliaAustriaAzerbaijanBahamas, TheBahrainBangladeshBarbadosBelarusBelgiumBelizeBeninBhutanBoliviaBotswanaBrazilBulgariaBurkina FasoBurundiCabo VerdeCambodiaCameroonCanadaCaribbean small statesCentral African RepublicCentral Europe and the BalticsChadChileChinaColombiaComorosCongo, Dem. Rep.Congo, Rep.Costa RicaCote d'IvoireCroatiaCubaCyprusCzech RepublicDenmarkDominicaDominican RepublicEarly-demographic dividendEast Asia & PacificEast Asia & Pacific (excluding high income)East Asia & Pacific (IDA & IBRD countries)EcuadorEgypt, Arab Rep.El SalvadorEritreaEstoniaEthiopiaEuro areaEurope & Central AsiaEurope & Central Asia (excluding high income)Europe & Central Asia (IDA & IBRD countries)European UnionFijiFinlandFragile and conflict affected situationsFranceGabonGambia, TheGeorgiaGermanyGhanaGreeceGuatemalaGuineaGuinea-BissauGuyanaHaitiHeavily indebted poor countries (HIPC)High incomeHondurasHungaryIBRD onlyIDA & IBRD totalIDA blendIDA onlyIDA totalIndiaIndonesiaIran, Islamic Rep.IraqIrelandIsraelItalyJamaicaJapanJordanKazakhstanKenyaKiribatiKorea, Rep.KuwaitKyrgyz RepublicLao PDRLate-demographic dividendLatin America & Caribbean Latin America & Caribbean (excluding high income)Latin America & the Caribbean (IDA & IBRD countries)LatviaLeast developed countries: UN classificationLebanonLesothoLiberiaLibyaLithuaniaLow & middle incomeLow incomeLower middle incomeLuxembourgMacedonia, FYRMadagascarMalawiMalaysiaMaldivesMaliMauritaniaMauritiusMexicoMiddle East & North AfricaMiddle East & North Africa (excluding high income)Middle East & North Africa (IDA & IBRD countries)Middle incomeMoldovaMongoliaMoroccoMozambiqueNamibiaNepalNetherlandsNew ZealandNicaraguaNigerNigeriaNorth AmericaNorwayOECD membersOmanOther small statesPacific island small statesPakistanPanamaPapua New GuineaParaguayPeruPhilippinesPolandPortugalPost-demographic dividendPre-demographic dividendQatarRomaniaRussian FederationRwandaSamoaSao Tome and PrincipeSaudi ArabiaSenegalSeychellesSierra LeoneSingaporeSlovak RepublicSloveniaSmall statesSolomon IslandsSouth AfricaSouth AsiaSouth Asia (IDA & IBRD)SpainSri LankaSt. LuciaSt. Vincent and the GrenadinesSub-Saharan Africa Sub-Saharan Africa (excluding high income)Sub-Saharan Africa (IDA & IBRD countries)SurinameSwazilandSwedenSwitzerlandTajikistanTanzaniaThailandTogoTongaTrinidad and TobagoTunisiaTurkeyTurkmenistanUgandaUkraineUnited Arab EmiratesUnited KingdomUnited StatesUpper middle incomeUruguayUzbekistanVanuatuVenezuela, RBVietnamWorldYemen, Rep.ZambiaZimbabwe línea de tiempo (timeline):
En esta escala de tiempo se presenta un gráfico de 1971 y 2015 de Austria. Los datos de 1970 están ausentes. El número de observaciones reales por fecha: 45.
Fuente (nombre):
Indicadores del desarrollo mundial
Fuente (organización):
World Bank staff estimates based on sources and methods in World Bank's "The Changing Wealth of Nations: Measuring Sustainable Development in the New Millennium" (2011).
Categorías:
Economy & Growth
Se ha actualizado:
23 abr 2017 año
Los indicadores de los cambios de valor en los últimos años
Mínimo:
127.512 bn
1 ene 1971 año
Máximo:
332.843 bn
1 ene 2009 año
A la fecha de observación
Valor
Cambio absoluto
El cambio con respecto al valor anterior
1 ene 1971 año
127.512 bn
+127.512 bn
0.0%
1 ene 1972 año
133.557 bn
+6.045 bn
4.74%
1 ene 1973 año
142.394 bn
+8.837 bn
6.62%
1 ene 1974 año
150.671 bn
+8.277 bn
5.81%
1 ene 1975 año
154.075 bn
+3.403 bn
2.26%
1 ene 1976 año
153.595 bn
-480.088 millones
-0.31%
1 ene 1977 año
160.573 bn
+6.978 bn
4.54%
1 ene 1978 año
166.943 bn
+6.371 bn
3.97%
1 ene 1979 año
167.451 bn
+508.01 millones
0.3%
1 ene 1980 año
176.168 bn
+8.717 bn
5.21%
1 ene 1981 año
176.177 bn
+9.248 millones
0.01%
1 ene 1982 año
174.097 bn
-2.08 bn
-1.18%
1 ene 1983 año
179.068 bn
+4.971 bn
2.86%
1 ene 1984 año
185.029 bn
+5.962 bn
3.33%
1 ene 1985 año
185.398 bn
+369.054 millones
0.2%
1 ene 1986 año
190.686 bn
+5.288 bn
2.85%
1 ene 1987 año
195.322 bn
+4.636 bn
2.43%
1 ene 1988 año
198.032 bn
+2.71 bn
1.39%
1 ene 1989 año
205.91 bn
+7.878 bn
3.98%
1 ene 1990 año
213.957 bn
+8.047 bn
3.91%
1 ene 1991 año
224.496 bn
+10.539 bn
4.93%
1 ene 1992 año
230.424 bn
+5.928 bn
2.64%
1 ene 1993 año
234.818 bn
+4.395 bn
1.91%
1 ene 1994 año
234.941 bn
+122.766 millones
0.05%
1 ene 1995 año
240.671 bn
+5.73 bn
2.44%
1 ene 1996 año
246.765 bn
+6.094 bn
2.53%
1 ene 1997 año
252.733 bn
+5.968 bn
2.42%
1 ene 1998 año
256.356 bn
+3.623 bn
1.43%
1 ene 1999 año
264.63 bn
+8.274 bn
3.23%
1 ene 2000 año
272.452 bn
+7.822 bn
2.96%
1 ene 2001 año
279.924 bn
+7.472 bn
2.74%
1 ene 2002 año
282.125 bn
+2.201 bn
0.79%
1 ene 2003 año
290.311 bn
+8.187 bn
2.9%
1 ene 2004 año
293.32 bn
+3.008 bn
1.04%
1 ene 2005 año
301.44 bn
+8.121 bn
2.77%
1 ene 2006 año
306.194 bn
+4.753 bn
1.58%
1 ene 2007 año
317.977 bn
+11.783 bn
3.85%
1 ene 2008 año
327.82 bn
+9.844 bn
3.1%
1 ene 2009 año
332.843 bn
+5.022 bn
1.53%
1 ene 2010 año
317.072 bn
-15.771 bn
-4.74%
1 ene 2011 año
324.425 bn
+7.353 bn
2.32%
1 ene 2012 año
329.424 bn
+4.998 bn
1.54%
1 ene 2013 año
329.186 bn
-237.075 millones
-0.07%
1 ene 2014 año
330.2 bn
+1.014 bn
0.31%
1 ene 2015 año
327.188 bn
-3.012 bn
-0.91%
Ranking de los países por los datos estadísticos actuales


Comentarios: