29
/es/
es
AIzaSyAYiBZKx7MnpbEhh9jyipgxe19OcubqV5w
April 1, 2024
35495
High income
HIC
false
2
1
Adjusted net national income (constant 2010 US$)
2015,2014,2013,2012,2011,2010,2009,2008,2007,2006,2005,2004,2003,2002,2001,2000,1999,1998,1997,1996,1995,1994,1993,1992,1991,1990,1989,1988,1987,1986,1985,1984,1983,1982,1981,1980,1979,1978,1977,1976,1975,1974,1973,1972,1971
Estas estadísticas en otros países:
AfghanistanAlbaniaAlgeriaAngolaArab WorldArgentinaArmeniaAustraliaAustriaAzerbaijanBahamas, TheBahrainBangladeshBarbadosBelarusBelgiumBelizeBeninBhutanBoliviaBotswanaBrazilBulgariaBurkina FasoBurundiCabo VerdeCambodiaCameroonCanadaCaribbean small statesCentral African RepublicCentral Europe and the BalticsChadChileChinaColombiaComorosCongo, Dem. Rep.Congo, Rep.Costa RicaCote d'IvoireCroatiaCubaCyprusCzech RepublicDenmarkDominicaDominican RepublicEarly-demographic dividendEast Asia & PacificEast Asia & Pacific (excluding high income)East Asia & Pacific (IDA & IBRD countries)EcuadorEgypt, Arab Rep.El SalvadorEritreaEstoniaEthiopiaEuro areaEurope & Central AsiaEurope & Central Asia (excluding high income)Europe & Central Asia (IDA & IBRD countries)European UnionFijiFinlandFragile and conflict affected situationsFranceGabonGambia, TheGeorgiaGermanyGhanaGreeceGuatemalaGuineaGuinea-BissauGuyanaHaitiHeavily indebted poor countries (HIPC)High incomeHondurasHungaryIBRD onlyIDA & IBRD totalIDA blendIDA onlyIDA totalIndiaIndonesiaIran, Islamic Rep.IraqIrelandIsraelItalyJamaicaJapanJordanKazakhstanKenyaKiribatiKorea, Rep.KuwaitKyrgyz RepublicLao PDRLate-demographic dividendLatin America & Caribbean Latin America & Caribbean (excluding high income)Latin America & the Caribbean (IDA & IBRD countries)LatviaLeast developed countries: UN classificationLebanonLesothoLiberiaLibyaLithuaniaLow & middle incomeLow incomeLower middle incomeLuxembourgMacedonia, FYRMadagascarMalawiMalaysiaMaldivesMaliMauritaniaMauritiusMexicoMiddle East & North AfricaMiddle East & North Africa (excluding high income)Middle East & North Africa (IDA & IBRD countries)Middle incomeMoldovaMongoliaMoroccoMozambiqueNamibiaNepalNetherlandsNew ZealandNicaraguaNigerNigeriaNorth AmericaNorwayOECD membersOmanOther small statesPacific island small statesPakistanPanamaPapua New GuineaParaguayPeruPhilippinesPolandPortugalPost-demographic dividendPre-demographic dividendQatarRomaniaRussian FederationRwandaSamoaSao Tome and PrincipeSaudi ArabiaSenegalSeychellesSierra LeoneSingaporeSlovak RepublicSloveniaSmall statesSolomon IslandsSouth AfricaSouth AsiaSouth Asia (IDA & IBRD)SpainSri LankaSt. LuciaSt. Vincent and the GrenadinesSub-Saharan Africa Sub-Saharan Africa (excluding high income)Sub-Saharan Africa (IDA & IBRD countries)SurinameSwazilandSwedenSwitzerlandTajikistanTanzaniaThailandTogoTongaTrinidad and TobagoTunisiaTurkeyTurkmenistanUgandaUkraineUnited Arab EmiratesUnited KingdomUnited StatesUpper middle incomeUruguayUzbekistanVanuatuVenezuela, RBVietnamWorldYemen, Rep.ZambiaZimbabwe línea de tiempo (timeline):
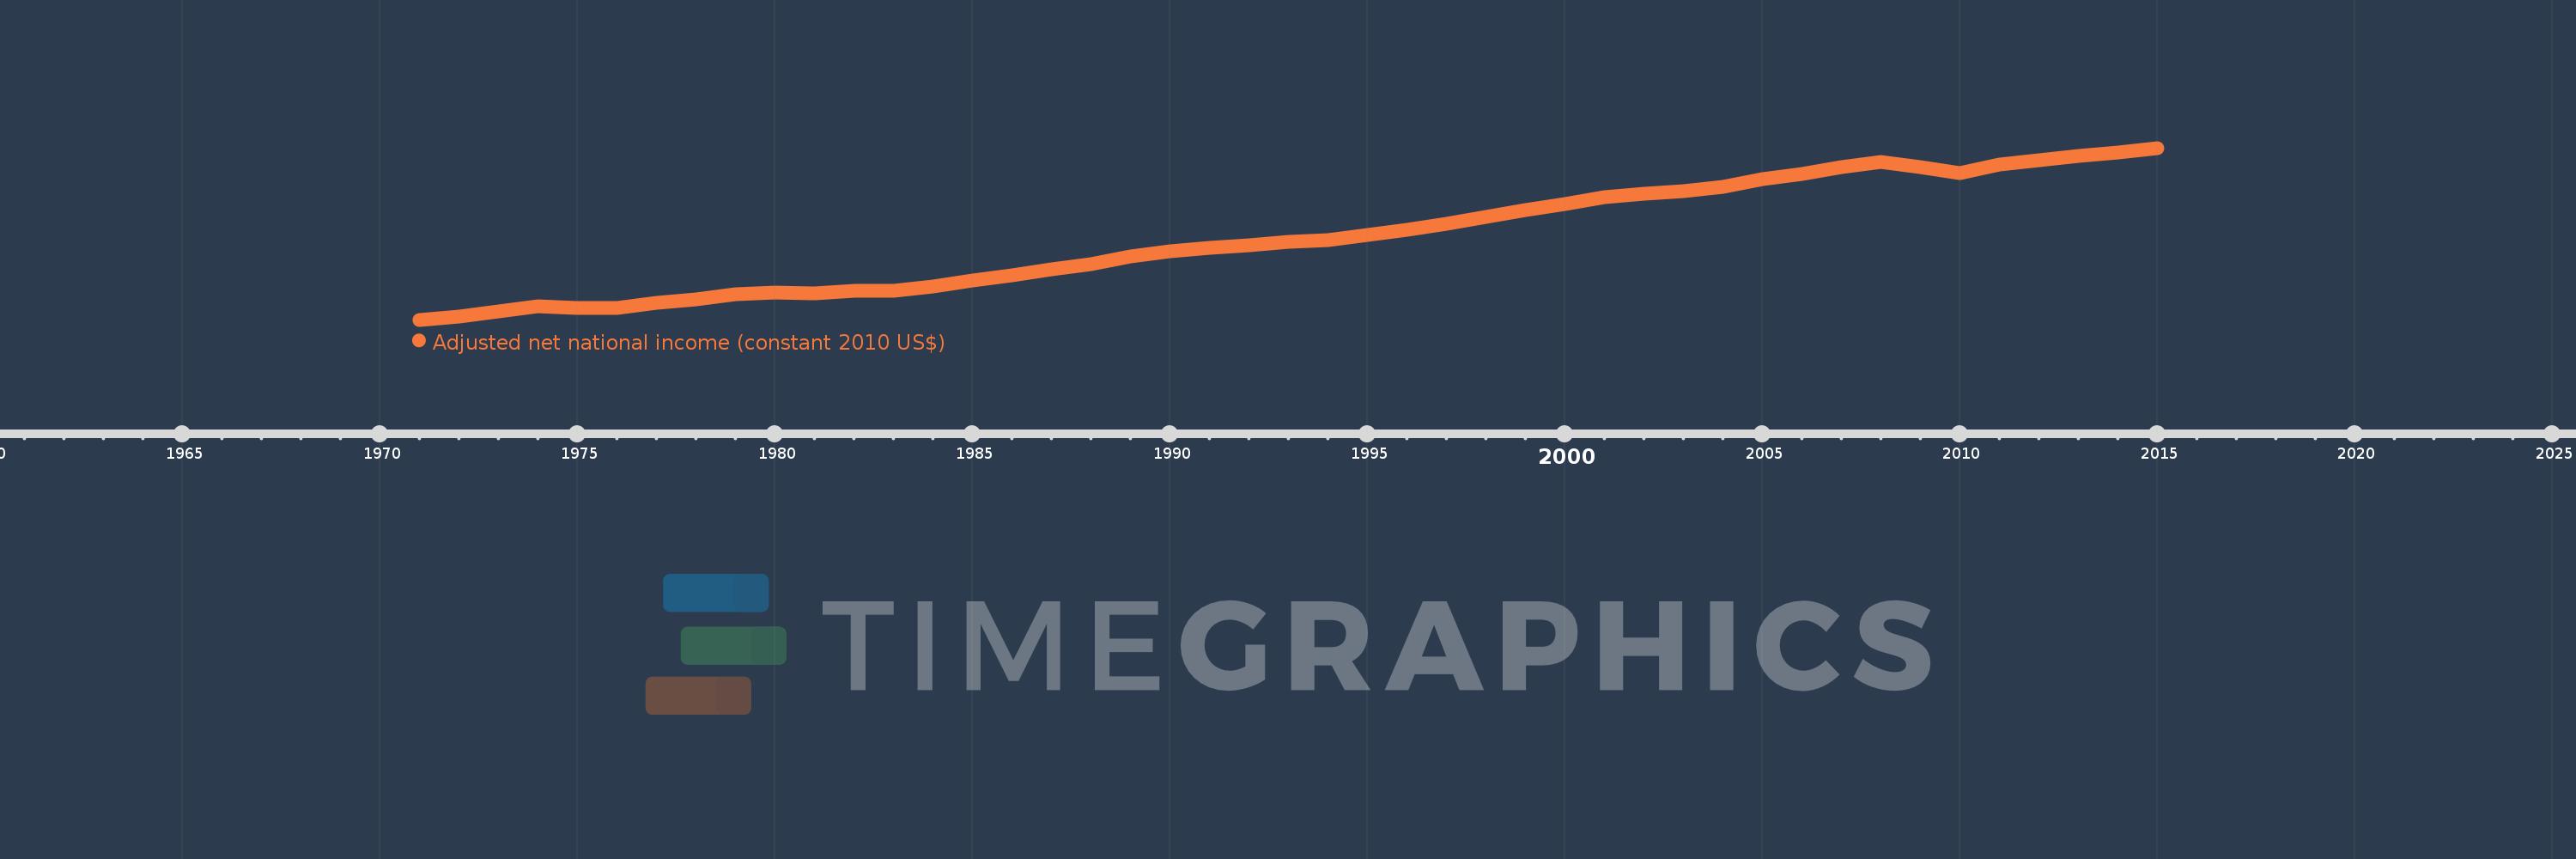
En esta escala de tiempo se presenta un gráfico de 1971 y 2015 de High income. Los datos de 1970 están ausentes. El número de observaciones reales por fecha: 45.
Fuente (nombre):
Indicadores del desarrollo mundial
Fuente (organización):
World Bank staff estimates based on sources and methods in World Bank's "The Changing Wealth of Nations: Measuring Sustainable Development in the New Millennium" (2011).
Categorías:
Economy & Growth
Se ha actualizado:
23 abr 2017 año
Los indicadores de los cambios de valor en los últimos años
En promedio:
25.966 billones
Mínimo:
13.405 billones
1 ene 1971 año
Máximo:
39.615 billones
1 ene 2015 año
A la fecha de observación
Valor
Cambio absoluto
El cambio con respecto al valor anterior
1 ene 1971 año
13.405 billones
+13.405 billones
0.0%
1 ene 1972 año
13.882 billones
+476.507 bn
3.55%
1 ene 1973 año
14.658 billones
+776.165 bn
5.59%
1 ene 1974 año
15.514 billones
+855.869 bn
5.84%
1 ene 1975 año
15.186 billones
-328.029 bn
-2.11%
1 ene 1976 año
15.229 billones
+43.53 bn
0.29%
1 ene 1977 año
15.951 billones
+721.486 bn
4.74%
1 ene 1978 año
16.528 billones
+577.497 bn
3.62%
1 ene 1979 año
17.316 billones
+787.388 bn
4.76%
1 ene 1980 año
17.592 billones
+275.822 bn
1.59%
1 ene 1981 año
17.494 billones
-97.975 bn
-0.56%
1 ene 1982 año
17.772 billones
+278.105 bn
1.59%
1 ene 1983 año
17.855 billones
+83.354 bn
0.47%
1 ene 1984 año
18.452 billones
+596.74 bn
3.34%
1 ene 1985 año
19.43 billones
+978.437 bn
5.3%
1 ene 1986 año
20.209 billones
+778.433 bn
4.01%
1 ene 1987 año
21.067 billones
+857.99 bn
4.25%
1 ene 1988 año
21.838 billones
+771.667 bn
3.66%
1 ene 1989 año
23.057 billones
+1.218 billones
5.58%
1 ene 1990 año
23.823 billones
+766.173 bn
3.32%
1 ene 1991 año
24.423 billones
+599.978 bn
2.52%
1 ene 1992 año
24.75 billones
+327.465 bn
1.34%
1 ene 1993 año
25.266 billones
+515.921 bn
2.08%
1 ene 1994 año
25.504 billones
+237.458 bn
0.94%
1 ene 1995 año
26.402 billones
+898.34 bn
3.52%
1 ene 1996 año
27.172 billones
+770.212 bn
2.92%
1 ene 1997 año
28.042 billones
+869.503 bn
3.2%
1 ene 1998 año
29.114 billones
+1.072 billones
3.82%
1 ene 1999 año
30.098 billones
+984.34 bn
3.38%
1 ene 2000 año
31.045 billones
+947.005 bn
3.15%
1 ene 2001 año
32.067 billones
+1.022 billones
3.29%
1 ene 2002 año
32.583 billones
+516.528 bn
1.61%
1 ene 2003 año
33.08 billones
+496.999 bn
1.53%
1 ene 2004 año
33.729 billones
+648.386 bn
1.96%
1 ene 2005 año
34.863 billones
+1.134 billones
3.36%
1 ene 2006 año
35.622 billones
+759.293 bn
2.18%
1 ene 2007 año
36.739 billones
+1.117 billones
3.14%
1 ene 2008 año
37.422 billones
+682.821 bn
1.86%
1 ene 2009 año
36.696 billones
-726.478 bn
-1.94%
1 ene 2010 año
35.835 billones
-860.546 bn
-2.35%
1 ene 2011 año
37.111 billones
+1.276 billones
3.56%
1 ene 2012 año
37.757 billones
+645.527 bn
1.74%
1 ene 2013 año
38.415 billones
+658.347 bn
1.74%
1 ene 2014 año
38.862 billones
+446.936 bn
1.16%
1 ene 2015 año
39.615 billones
+753.598 bn
1.94%
Ranking de los países por los datos estadísticos actuales


Comentarios: