29
/es/
es
AIzaSyAYiBZKx7MnpbEhh9jyipgxe19OcubqV5w
April 1, 2024
72902
Australia
AUS
true
2
1
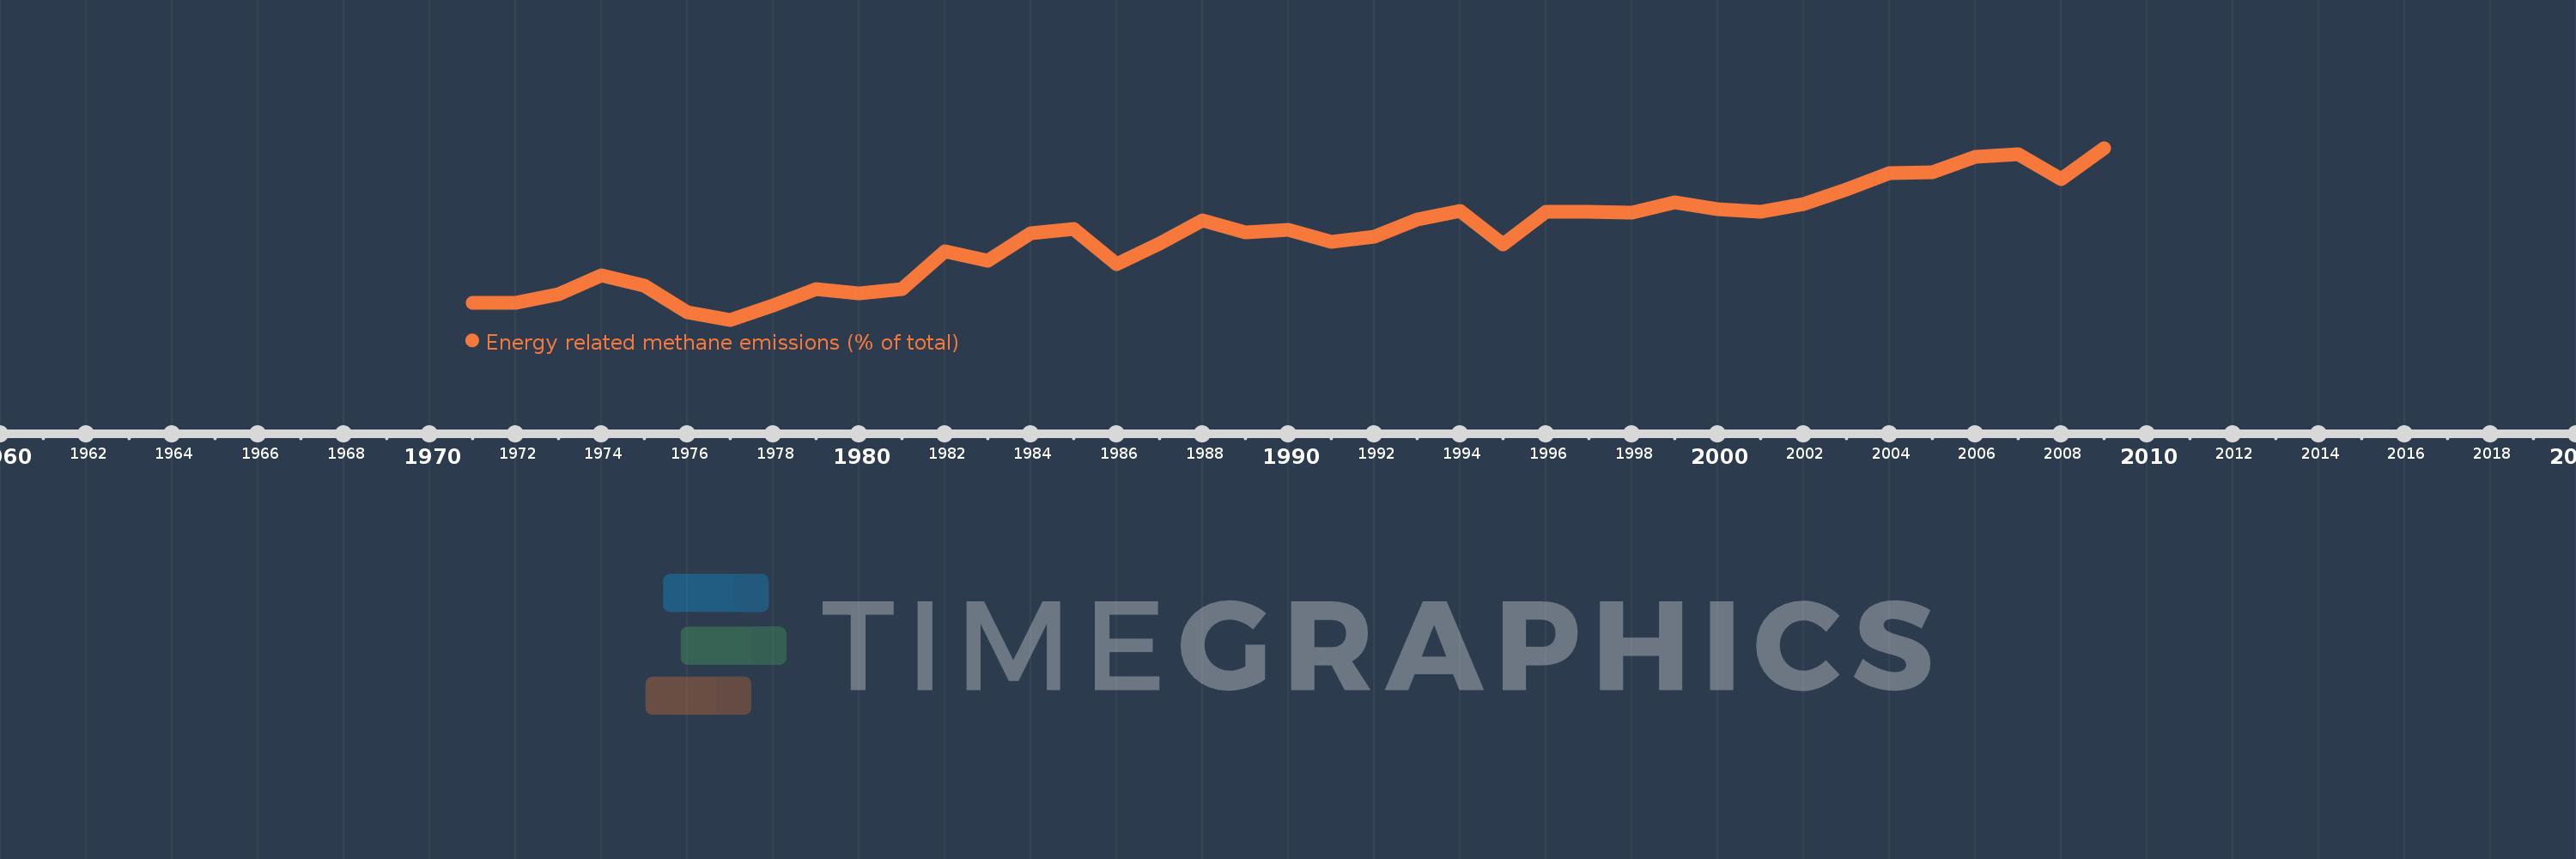
Energy related methane emissions (% of total)
2009,2008,2007,2006,2005,2004,2003,2002,2001,2000,1999,1998,1997,1996,1995,1994,1993,1992,1991,1990,1989,1988,1987,1986,1985,1984,1983,1982,1981,1980,1979,1978,1977,1976,1975,1974,1973,1972,1971
Estas estadísticas en otros países:
AfghanistanAlbaniaAlgeriaAmerican SamoaAngolaAntigua and BarbudaArab WorldArgentinaArmeniaArubaAustraliaAustriaAzerbaijanBahamas, TheBahrainBangladeshBarbadosBelarusBelgiumBelizeBeninBermudaBhutanBoliviaBosnia and HerzegovinaBotswanaBrazilBritish Virgin IslandsBrunei DarussalamBulgariaBurkina FasoBurundiCabo VerdeCambodiaCameroonCanadaCaribbean small statesCayman IslandsCentral African RepublicCentral Europe and the BalticsChadChileChinaColombiaComorosCongo, Dem. Rep.Congo, Rep.Costa RicaCote d'IvoireCroatiaCubaCyprusCzech RepublicDenmarkDjiboutiDominicaDominican RepublicEarly-demographic dividendEast Asia & PacificEast Asia & Pacific (excluding high income)East Asia & Pacific (IDA & IBRD countries)EcuadorEgypt, Arab Rep.El SalvadorEquatorial GuineaEritreaEstoniaEthiopiaEuro areaEurope & Central AsiaEurope & Central Asia (excluding high income)Europe & Central Asia (IDA & IBRD countries)European UnionFaroe IslandsFijiFinlandFragile and conflict affected situationsFranceFrench PolynesiaGabonGambia, TheGeorgiaGermanyGhanaGibraltarGreeceGreenlandGrenadaGuamGuatemalaGuineaGuinea-BissauGuyanaHaitiHeavily indebted poor countries (HIPC)High incomeHondurasHong Kong SAR, ChinaHungaryIBRD onlyIcelandIDA & IBRD totalIDA blendIDA onlyIDA totalIndiaIndonesiaIran, Islamic Rep.IraqIrelandIsraelItalyJamaicaJapanJordanKazakhstanKenyaKiribatiKorea, Dem. People’s Rep.Korea, Rep.KuwaitKyrgyz RepublicLao PDRLate-demographic dividendLatin America & Caribbean Latin America & Caribbean (excluding high income)Latin America & the Caribbean (IDA & IBRD countries)LatviaLeast developed countries: UN classificationLebanonLesothoLiberiaLibyaLithuaniaLow & middle incomeLow incomeLower middle incomeLuxembourgMacao SAR, ChinaMacedonia, FYRMadagascarMalawiMalaysiaMaldivesMaliMaltaMarshall IslandsMauritaniaMauritiusMexicoMicronesia, Fed. Sts.Middle East & North AfricaMiddle East & North Africa (excluding high income)Middle East & North Africa (IDA & IBRD countries)Middle incomeMoldovaMongoliaMoroccoMozambiqueMyanmarNamibiaNauruNepalNetherlandsNew CaledoniaNew ZealandNicaraguaNigerNigeriaNorth AmericaNorthern Mariana IslandsNorwayOECD membersOmanOther small statesPacific island small statesPakistanPalauPanamaPapua New GuineaParaguayPeruPhilippinesPolandPortugalPost-demographic dividendPre-demographic dividendPuerto RicoQatarRomaniaRussian FederationRwandaSamoaSao Tome and PrincipeSaudi ArabiaSenegalSerbiaSeychellesSierra LeoneSingaporeSlovak RepublicSloveniaSmall statesSolomon IslandsSomaliaSouth AfricaSouth AsiaSouth Asia (IDA & IBRD)SpainSri LankaSt. Kitts and NevisSt. LuciaSt. Vincent and the GrenadinesSub-Saharan Africa Sub-Saharan Africa (excluding high income)Sub-Saharan Africa (IDA & IBRD countries)SudanSurinameSwazilandSwedenSwitzerlandSyrian Arab RepublicTajikistanTanzaniaThailandTimor-LesteTogoTongaTrinidad and TobagoTunisiaTurkeyTurkmenistanTurks and Caicos IslandsTuvaluUgandaUkraineUnited Arab EmiratesUnited KingdomUnited StatesUpper middle incomeUruguayUzbekistanVanuatuVenezuela, RBVietnamVirgin Islands (U.S.)WorldYemen, Rep.ZambiaZimbabwe línea de tiempo (timeline):
En esta escala de tiempo se presenta un gráfico de 1971 y 2009 de Australia. Los datos de 1970 están ausentes. El número de observaciones reales por fecha: 39.
Fuente (nombre):
Indicadores del desarrollo mundial
Fuente (organización):
World Bank staff estimates from original source: European Commission, Joint Research Centre (JRC)/Netherlands Environmental Assessment Agency (PBL). Emission Database for Global Atmospheric Research (EDGAR): http://edgar.jrc.ec.europa.eu/.
Categorías:
Energy & Mining, Environment
Se ha actualizado:
23 abr 2017 año
Los indicadores de los cambios de valor en los últimos años
Mínimo:
12.75
1 ene 1977 año
Máximo:
31.955
1 ene 2009 año
A la fecha de observación
Valor
Cambio absoluto
El cambio con respecto al valor anterior
1 ene 1971 año
14.645
+14.645
0.0%
1 ene 1972 año
14.631
-0.014
-0.1%
1 ene 1973 año
15.646
+1.015
6.94%
1 ene 1974 año
17.755
+2.109
13.48%
1 ene 1975 año
16.593
-1.162
-6.54%
1 ene 1976 año
13.6
-2.993
-18.04%
1 ene 1977 año
12.75
-0.849
-6.25%
1 ene 1978 año
14.355
+1.604
12.58%
1 ene 1979 año
16.145
+1.791
12.48%
1 ene 1980 año
15.702
-0.444
-2.75%
1 ene 1981 año
16.154
+0.452
2.88%
1 ene 1982 año
20.402
+4.248
26.29%
1 ene 1983 año
19.359
-1.042
-5.11%
1 ene 1984 año
22.417
+3.057
15.79%
1 ene 1985 año
22.887
+0.47
2.1%
1 ene 1986 año
18.931
-3.956
-17.28%
1 ene 1987 año
21.224
+2.293
12.11%
1 ene 1988 año
23.902
+2.678
12.62%
1 ene 1989 año
22.501
-1.401
-5.86%
1 ene 1990 año
22.836
+0.335
1.49%
1 ene 1991 año
21.429
-1.407
-6.16%
1 ene 1992 año
21.998
+0.568
2.65%
1 ene 1993 año
23.995
+1.998
9.08%
1 ene 1994 año
24.957
+0.962
4.01%
1 ene 1995 año
21.135
-3.822
-15.31%
1 ene 1996 año
24.78
+3.645
17.25%
1 ene 1997 año
24.812
+0.032
0.13%
1 ene 1998 año
24.721
-0.091
-0.37%
1 ene 1999 año
25.883
+1.162
4.7%
1 ene 2000 año
25.084
-0.799
-3.09%
1 ene 2001 año
24.799
-0.285
-1.14%
1 ene 2002 año
25.716
+0.918
3.7%
1 ene 2003 año
27.283
+1.567
6.09%
1 ene 2004 año
29.102
+1.819
6.67%
1 ene 2005 año
29.233
+0.13
0.45%
1 ene 2006 año
30.951
+1.719
5.88%
1 ene 2007 año
31.218
+0.267
0.86%
1 ene 2008 año
28.486
-2.732
-8.75%
1 ene 2009 año
31.955
+3.469
12.18%
Ranking de los países por los datos estadísticos actuales


Comentarios: