29
/es/
es
AIzaSyAYiBZKx7MnpbEhh9jyipgxe19OcubqV5w
April 1, 2024
192943
Mauritania
MRT
true
2
1
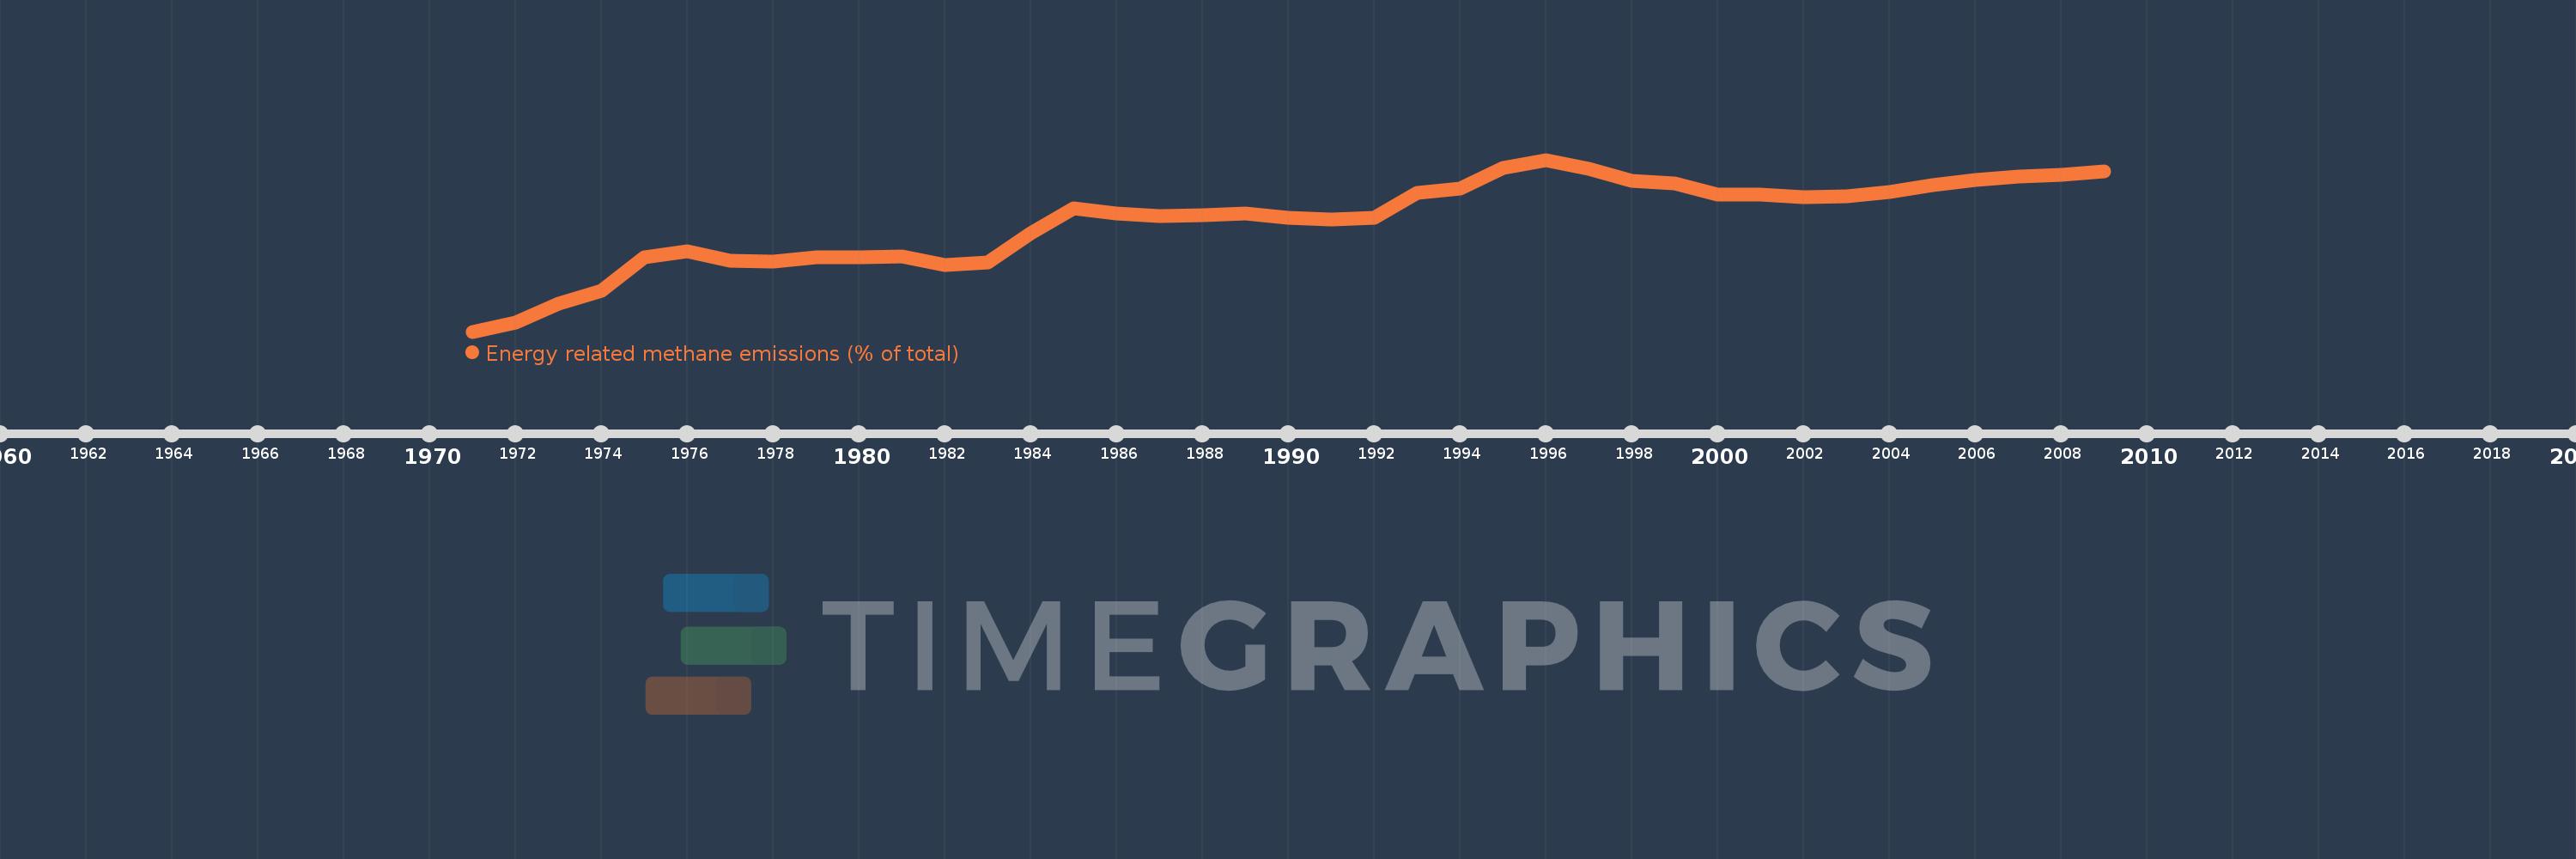
Energy related methane emissions (% of total)
2009,2008,2007,2006,2005,2004,2003,2002,2001,2000,1999,1998,1997,1996,1995,1994,1993,1992,1991,1990,1989,1988,1987,1986,1985,1984,1983,1982,1981,1980,1979,1978,1977,1976,1975,1974,1973,1972,1971
Estas estadísticas en otros países:
AfghanistanAlbaniaAlgeriaAmerican SamoaAngolaAntigua and BarbudaArab WorldArgentinaArmeniaArubaAustraliaAustriaAzerbaijanBahamas, TheBahrainBangladeshBarbadosBelarusBelgiumBelizeBeninBermudaBhutanBoliviaBosnia and HerzegovinaBotswanaBrazilBritish Virgin IslandsBrunei DarussalamBulgariaBurkina FasoBurundiCabo VerdeCambodiaCameroonCanadaCaribbean small statesCayman IslandsCentral African RepublicCentral Europe and the BalticsChadChileChinaColombiaComorosCongo, Dem. Rep.Congo, Rep.Costa RicaCote d'IvoireCroatiaCubaCyprusCzech RepublicDenmarkDjiboutiDominicaDominican RepublicEarly-demographic dividendEast Asia & PacificEast Asia & Pacific (excluding high income)East Asia & Pacific (IDA & IBRD countries)EcuadorEgypt, Arab Rep.El SalvadorEquatorial GuineaEritreaEstoniaEthiopiaEuro areaEurope & Central AsiaEurope & Central Asia (excluding high income)Europe & Central Asia (IDA & IBRD countries)European UnionFaroe IslandsFijiFinlandFragile and conflict affected situationsFranceFrench PolynesiaGabonGambia, TheGeorgiaGermanyGhanaGibraltarGreeceGreenlandGrenadaGuamGuatemalaGuineaGuinea-BissauGuyanaHaitiHeavily indebted poor countries (HIPC)High incomeHondurasHong Kong SAR, ChinaHungaryIBRD onlyIcelandIDA & IBRD totalIDA blendIDA onlyIDA totalIndiaIndonesiaIran, Islamic Rep.IraqIrelandIsraelItalyJamaicaJapanJordanKazakhstanKenyaKiribatiKorea, Dem. People’s Rep.Korea, Rep.KuwaitKyrgyz RepublicLao PDRLate-demographic dividendLatin America & Caribbean Latin America & Caribbean (excluding high income)Latin America & the Caribbean (IDA & IBRD countries)LatviaLeast developed countries: UN classificationLebanonLesothoLiberiaLibyaLithuaniaLow & middle incomeLow incomeLower middle incomeLuxembourgMacao SAR, ChinaMacedonia, FYRMadagascarMalawiMalaysiaMaldivesMaliMaltaMarshall IslandsMauritaniaMauritiusMexicoMicronesia, Fed. Sts.Middle East & North AfricaMiddle East & North Africa (excluding high income)Middle East & North Africa (IDA & IBRD countries)Middle incomeMoldovaMongoliaMoroccoMozambiqueMyanmarNamibiaNauruNepalNetherlandsNew CaledoniaNew ZealandNicaraguaNigerNigeriaNorth AmericaNorthern Mariana IslandsNorwayOECD membersOmanOther small statesPacific island small statesPakistanPalauPanamaPapua New GuineaParaguayPeruPhilippinesPolandPortugalPost-demographic dividendPre-demographic dividendPuerto RicoQatarRomaniaRussian FederationRwandaSamoaSao Tome and PrincipeSaudi ArabiaSenegalSerbiaSeychellesSierra LeoneSingaporeSlovak RepublicSloveniaSmall statesSolomon IslandsSomaliaSouth AfricaSouth AsiaSouth Asia (IDA & IBRD)SpainSri LankaSt. Kitts and NevisSt. LuciaSt. Vincent and the GrenadinesSub-Saharan Africa Sub-Saharan Africa (excluding high income)Sub-Saharan Africa (IDA & IBRD countries)SudanSurinameSwazilandSwedenSwitzerlandSyrian Arab RepublicTajikistanTanzaniaThailandTimor-LesteTogoTongaTrinidad and TobagoTunisiaTurkeyTurkmenistanTurks and Caicos IslandsTuvaluUgandaUkraineUnited Arab EmiratesUnited KingdomUnited StatesUpper middle incomeUruguayUzbekistanVanuatuVenezuela, RBVietnamVirgin Islands (U.S.)WorldYemen, Rep.ZambiaZimbabwe línea de tiempo (timeline):
En esta escala de tiempo se presenta un gráfico de 1971 y 2009 de Mauritania. Los datos de 1970 están ausentes. El número de observaciones reales por fecha: 39.
Fuente (nombre):
Indicadores del desarrollo mundial
Fuente (organización):
World Bank staff estimates from original source: European Commission, Joint Research Centre (JRC)/Netherlands Environmental Assessment Agency (PBL). Emission Database for Global Atmospheric Research (EDGAR): http://edgar.jrc.ec.europa.eu/.
Categorías:
Energy & Mining, Environment
Se ha actualizado:
23 abr 2017 año
Los indicadores de los cambios de valor en los últimos años
Mínimo:
4.441
1 ene 1971 año
Máximo:
8.936
1 ene 1996 año
A la fecha de observación
Valor
Cambio absoluto
El cambio con respecto al valor anterior
1 ene 1971 año
4.441
+4.441
0.0%
1 ene 1972 año
4.667
+0.226
5.08%
1 ene 1973 año
5.18
+0.513
11.0%
1 ene 1974 año
5.51
+0.33
6.36%
1 ene 1975 año
6.385
+0.876
15.89%
1 ene 1976 año
6.545
+0.159
2.49%
1 ene 1977 año
6.293
-0.252
-3.84%
1 ene 1978 año
6.273
-0.02
-0.32%
1 ene 1979 año
6.391
+0.119
1.89%
1 ene 1980 año
6.39
-0.001
-0.02%
1 ene 1981 año
6.408
+0.018
0.27%
1 ene 1982 año
6.172
-0.235
-3.67%
1 ene 1983 año
6.253
+0.081
1.31%
1 ene 1984 año
7.005
+0.752
12.02%
1 ene 1985 año
7.675
+0.67
9.57%
1 ene 1986 año
7.53
-0.145
-1.89%
1 ene 1987 año
7.465
-0.065
-0.87%
1 ene 1988 año
7.48
+0.015
0.2%
1 ene 1989 año
7.528
+0.048
0.65%
1 ene 1990 año
7.413
-0.115
-1.53%
1 ene 1991 año
7.373
-0.04
-0.54%
1 ene 1992 año
7.429
+0.056
0.76%
1 ene 1993 año
8.078
+0.649
8.74%
1 ene 1994 año
8.177
+0.098
1.21%
1 ene 1995 año
8.712
+0.536
6.55%
1 ene 1996 año
8.936
+0.224
2.57%
1 ene 1997 año
8.71
-0.226
-2.53%
1 ene 1998 año
8.395
-0.315
-3.61%
1 ene 1999 año
8.32
-0.075
-0.9%
1 ene 2000 año
8.017
-0.303
-3.64%
1 ene 2001 año
8.015
-0.001
-0.02%
1 ene 2002 año
7.951
-0.064
-0.8%
1 ene 2003 año
7.982
+0.031
0.39%
1 ene 2004 año
8.095
+0.113
1.41%
1 ene 2005 año
8.27
+0.175
2.16%
1 ene 2006 año
8.408
+0.138
1.67%
1 ene 2007 año
8.494
+0.086
1.03%
1 ene 2008 año
8.539
+0.045
0.53%
1 ene 2009 año
8.638
+0.099
1.16%
Ranking de los países por los datos estadísticos actuales


Comentarios: