29
/es/
es
AIzaSyAYiBZKx7MnpbEhh9jyipgxe19OcubqV5w
April 1, 2024
72673
Australia
AUS
true
2
1
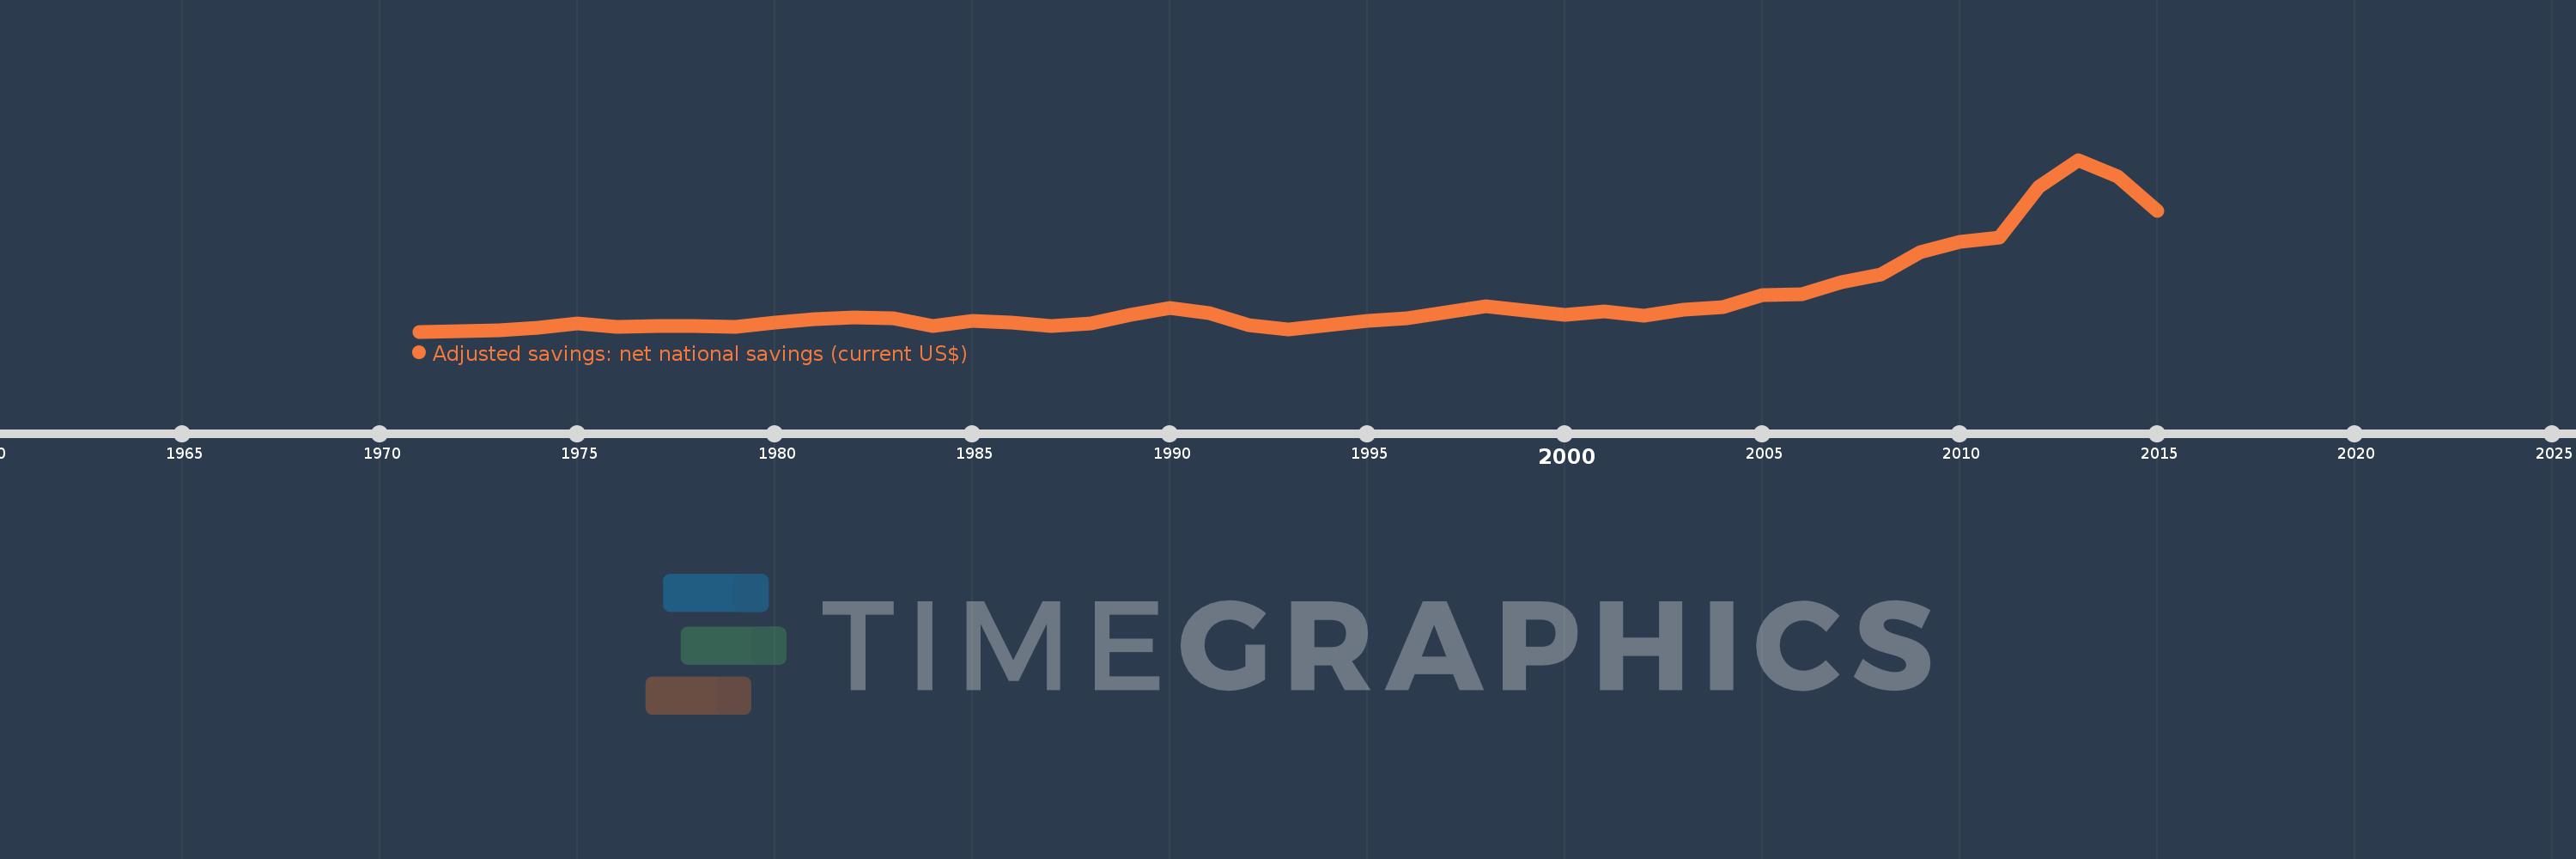
Adjusted savings: net national savings (current US$)
2015,2014,2013,2012,2011,2010,2009,2008,2007,2006,2005,2004,2003,2002,2001,2000,1999,1998,1997,1996,1995,1994,1993,1992,1991,1990,1989,1988,1987,1986,1985,1984,1983,1982,1981,1980,1979,1978,1977,1976,1975,1974,1973,1972,1971
Estas estadísticas en otros países:
AfghanistanAlbaniaAlgeriaAngolaAntigua and BarbudaArgentinaArmeniaAustraliaAustriaAzerbaijanBahamas, TheBahrainBangladeshBarbadosBelarusBelgiumBelizeBeninBermudaBhutanBoliviaBosnia and HerzegovinaBotswanaBrazilBrunei DarussalamBulgariaBurkina FasoBurundiCabo VerdeCambodiaCameroonCanadaCentral African RepublicChadChileChinaColombiaComorosCongo, Dem. Rep.Congo, Rep.Costa RicaCote d'IvoireCroatiaCyprusCzech RepublicDenmarkDjiboutiDominicaDominican RepublicEcuadorEgypt, Arab Rep.El SalvadorEquatorial GuineaEritreaEstoniaEthiopiaFijiFinlandFranceGabonGambia, TheGeorgiaGermanyGhanaGreeceGrenadaGuatemalaGuineaGuinea-BissauGuyanaHaitiHondurasHong Kong SAR, ChinaHungaryIcelandIndiaIndonesiaIran, Islamic Rep.IraqIrelandIsraelItalyJamaicaJapanJordanKazakhstanKenyaKiribatiKorea, Rep.KosovoKuwaitKyrgyz RepublicLao PDRLatviaLebanonLesothoLiberiaLibyaLithuaniaLuxembourgMacao SAR, ChinaMacedonia, FYRMadagascarMalawiMalaysiaMaldivesMaliMaltaMauritaniaMauritiusMexicoMoldovaMongoliaMontenegroMoroccoMozambiqueNamibiaNepalNetherlandsNew ZealandNicaraguaNigerNigeriaNorwayOmanPakistanPanamaPapua New GuineaParaguayPeruPhilippinesPolandPortugalQatarRomaniaRussian FederationRwandaSaudi ArabiaSenegalSerbiaSeychellesSierra LeoneSingaporeSlovak RepublicSloveniaSolomon IslandsSouth AfricaSpainSri LankaSt. Kitts and NevisSt. LuciaSt. Vincent and the GrenadinesSudanSurinameSwazilandSwedenSwitzerlandSyrian Arab RepublicTajikistanTanzaniaThailandTimor-LesteTogoTongaTrinidad and TobagoTunisiaTurkeyTurkmenistanUgandaUkraineUnited KingdomUnited StatesUruguayVanuatuVenezuela, RBVietnamWest Bank and GazaYemen, Rep.ZambiaZimbabwe línea de tiempo (timeline):
En esta escala de tiempo se presenta un gráfico de 1971 y 2015 de Australia. Los datos de 1970 están ausentes. El número de observaciones reales por fecha: 45.
Fuente (nombre):
Indicadores del desarrollo mundial
Fuente (organización):
World Bank staff estimates based on sources and methods in World Bank's "The Changing Wealth of Nations: Measuring Sustainable Development in the New Millennium" (2011).
Categorías:
Economy & Growth, Environment
Se ha actualizado:
23 abr 2017 año
Los indicadores de los cambios de valor en los últimos años
Mínimo:
5.686 bn
1 ene 1971 año
Máximo:
140.241 bn
1 ene 2013 año
A la fecha de observación
Valor
Cambio absoluto
El cambio con respecto al valor anterior
1 ene 1971 año
5.686 bn
+5.686 bn
0.0%
1 ene 1972 año
5.796 bn
+110.584 millones
1.94%
1 ene 1973 año
6.779 bn
+983.3 millones
16.96%
1 ene 1974 año
8.643 bn
+1.863 bn
27.49%
1 ene 1975 año
12.017 bn
+3.374 bn
39.04%
1 ene 1976 año
9.155 bn
-2.862 bn
-23.81%
1 ene 1977 año
10.064 bn
+909.042 millones
9.93%
1 ene 1978 año
9.821 bn
-243.46 millones
-2.42%
1 ene 1979 año
9.08 bn
-740.989 millones
-7.55%
1 ene 1980 año
12.712 bn
+3.632 bn
40.0%
1 ene 1981 año
15.118 bn
+2.406 bn
18.93%
1 ene 1982 año
17.017 bn
+1.899 bn
12.56%
1 ene 1983 año
16.325 bn
-691.576 millones
-4.06%
1 ene 1984 año
10.334 bn
-5.991 bn
-36.7%
1 ene 1985 año
14.028 bn
+3.693 bn
35.74%
1 ene 1986 año
12.644 bn
-1.383 bn
-9.86%
1 ene 1987 año
10.168 bn
-2.476 bn
-19.58%
1 ene 1988 año
11.978 bn
+1.809 bn
17.79%
1 ene 1989 año
19.003 bn
+7.026 bn
58.66%
1 ene 1990 año
24.5 bn
+5.497 bn
28.93%
1 ene 1991 año
20.109 bn
-4.391 bn
-17.92%
1 ene 1992 año
10.505 bn
-9.605 bn
-47.76%
1 ene 1993 año
7.518 bn
-2.986 bn
-28.43%
1 ene 1994 año
10.672 bn
+3.154 bn
41.95%
1 ene 1995 año
13.884 bn
+3.212 bn
30.1%
1 ene 1996 año
16.204 bn
+2.32 bn
16.71%
1 ene 1997 año
20.776 bn
+4.572 bn
28.22%
1 ene 1998 año
25.31 bn
+4.535 bn
21.83%
1 ene 1999 año
21.933 bn
-3.378 bn
-13.35%
1 ene 2000 año
18.594 bn
-3.339 bn
-15.22%
1 ene 2001 año
21.163 bn
+2.569 bn
13.82%
1 ene 2002 año
18.028 bn
-3.135 bn
-14.81%
1 ene 2003 año
22.942 bn
+4.914 bn
27.26%
1 ene 2004 año
24.665 bn
+1.722 bn
7.51%
1 ene 2005 año
34.303 bn
+9.638 bn
39.08%
1 ene 2006 año
34.707 bn
+404.361 millones
1.18%
1 ene 2007 año
44.387 bn
+9.68 bn
27.89%
1 ene 2008 año
50.125 bn
+5.738 bn
12.93%
1 ene 2009 año
67.935 bn
+17.81 bn
35.53%
1 ene 2010 año
76.256 bn
+8.321 bn
12.25%
1 ene 2011 año
79.224 bn
+2.968 bn
3.89%
1 ene 2012 año
119.198 bn
+39.974 bn
50.46%
1 ene 2013 año
140.241 bn
+21.043 bn
17.65%
1 ene 2014 año
126.859 bn
-13.381 bn
-9.54%
1 ene 2015 año
100.181 bn
-26.679 bn
-21.03%
Ranking de los países por los datos estadísticos actuales


Comentarios: