29
/es/
es
AIzaSyAYiBZKx7MnpbEhh9jyipgxe19OcubqV5w
April 1, 2024
132859
Finland
FIN
true
2
1
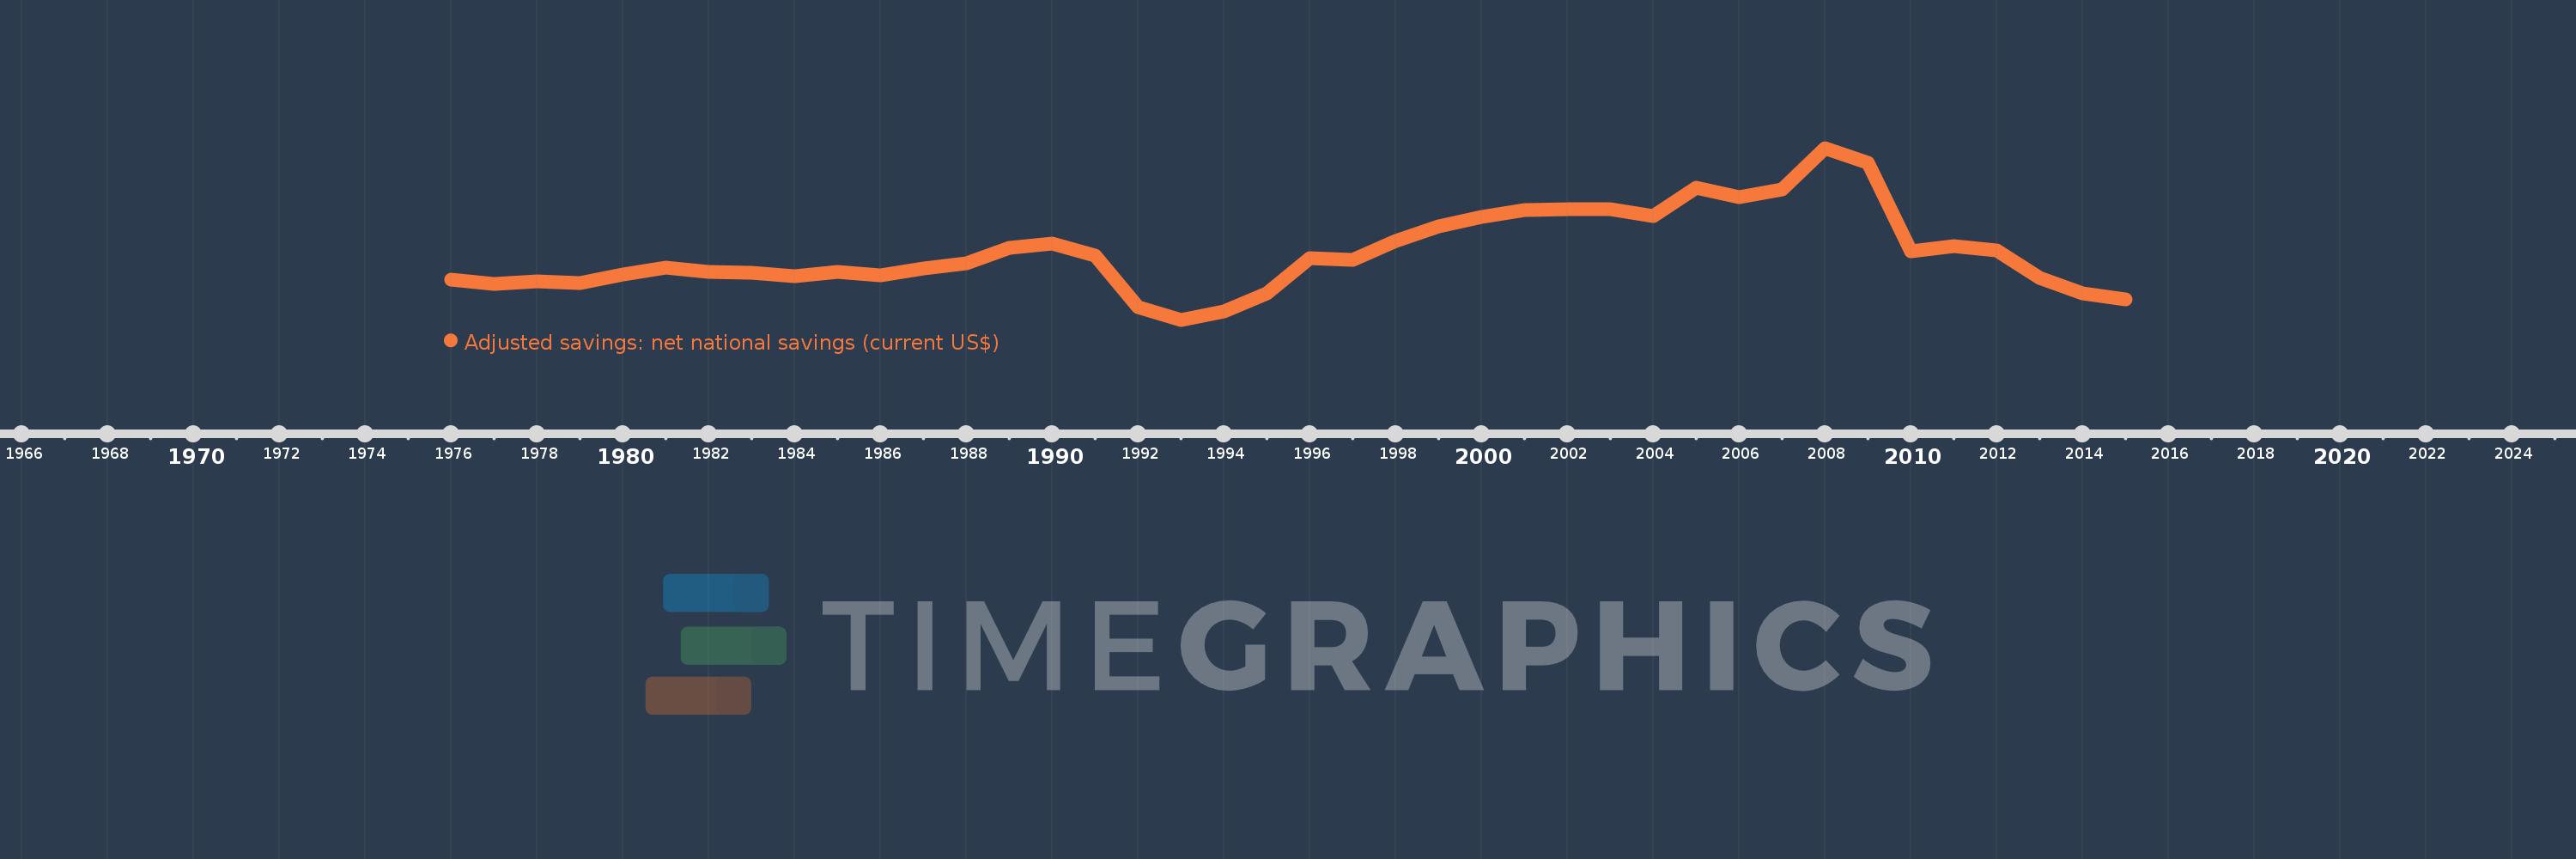
Adjusted savings: net national savings (current US$)
2015,2014,2013,2012,2011,2010,2009,2008,2007,2006,2005,2004,2003,2002,2001,2000,1999,1998,1997,1996,1995,1994,1993,1992,1991,1990,1989,1988,1987,1986,1985,1984,1983,1982,1981,1980,1979,1978,1977,1976
Estas estadísticas en otros países:
AfghanistanAlbaniaAlgeriaAngolaAntigua and BarbudaArgentinaArmeniaAustraliaAustriaAzerbaijanBahamas, TheBahrainBangladeshBarbadosBelarusBelgiumBelizeBeninBermudaBhutanBoliviaBosnia and HerzegovinaBotswanaBrazilBrunei DarussalamBulgariaBurkina FasoBurundiCabo VerdeCambodiaCameroonCanadaCentral African RepublicChadChileChinaColombiaComorosCongo, Dem. Rep.Congo, Rep.Costa RicaCote d'IvoireCroatiaCyprusCzech RepublicDenmarkDjiboutiDominicaDominican RepublicEcuadorEgypt, Arab Rep.El SalvadorEquatorial GuineaEritreaEstoniaEthiopiaFijiFinlandFranceGabonGambia, TheGeorgiaGermanyGhanaGreeceGrenadaGuatemalaGuineaGuinea-BissauGuyanaHaitiHondurasHong Kong SAR, ChinaHungaryIcelandIndiaIndonesiaIran, Islamic Rep.IraqIrelandIsraelItalyJamaicaJapanJordanKazakhstanKenyaKiribatiKorea, Rep.KosovoKuwaitKyrgyz RepublicLao PDRLatviaLebanonLesothoLiberiaLibyaLithuaniaLuxembourgMacao SAR, ChinaMacedonia, FYRMadagascarMalawiMalaysiaMaldivesMaliMaltaMauritaniaMauritiusMexicoMoldovaMongoliaMontenegroMoroccoMozambiqueNamibiaNepalNetherlandsNew ZealandNicaraguaNigerNigeriaNorwayOmanPakistanPanamaPapua New GuineaParaguayPeruPhilippinesPolandPortugalQatarRomaniaRussian FederationRwandaSaudi ArabiaSenegalSerbiaSeychellesSierra LeoneSingaporeSlovak RepublicSloveniaSolomon IslandsSouth AfricaSpainSri LankaSt. Kitts and NevisSt. LuciaSt. Vincent and the GrenadinesSudanSurinameSwazilandSwedenSwitzerlandSyrian Arab RepublicTajikistanTanzaniaThailandTimor-LesteTogoTongaTrinidad and TobagoTunisiaTurkeyTurkmenistanUgandaUkraineUnited KingdomUnited StatesUruguayVanuatuVenezuela, RBVietnamWest Bank and GazaYemen, Rep.ZambiaZimbabwe línea de tiempo (timeline):
En esta escala de tiempo se presenta un gráfico de 1976 y 2015 de Finland. Los datos de 1975 están ausentes. El número de observaciones reales por fecha: 40.
Fuente (nombre):
Indicadores del desarrollo mundial
Fuente (organización):
World Bank staff estimates based on sources and methods in World Bank's "The Changing Wealth of Nations: Measuring Sustainable Development in the New Millennium" (2011).
Categorías:
Economy & Growth, Environment
Se ha actualizado:
23 abr 2017 año
Los indicadores de los cambios de valor en los últimos años
Mínimo:
-4.385 bn
1 ene 1993 año
Máximo:
31.919 bn
1 ene 2008 año
A la fecha de observación
Valor
Cambio absoluto
El cambio con respecto al valor anterior
1 ene 1976 año
4.009 bn
+4.009 bn
0.0%
1 ene 1977 año
3.225 bn
-783.53 millones
-19.55%
1 ene 1978 año
3.742 bn
+517.089 millones
16.03%
1 ene 1979 año
3.386 bn
-355.876 millones
-9.51%
1 ene 1980 año
5.134 bn
+1.748 bn
51.6%
1 ene 1981 año
6.584 bn
+1.45 bn
28.25%
1 ene 1982 año
5.758 bn
-826.336 millones
-12.55%
1 ene 1983 año
5.483 bn
-275.31 millones
-4.78%
1 ene 1984 año
4.836 bn
-646.418 millones
-11.79%
1 ene 1985 año
5.737 bn
+900.734 millones
18.62%
1 ene 1986 año
4.983 bn
-754.222 millones
-13.15%
1 ene 1987 año
6.407 bn
+1.424 bn
28.57%
1 ene 1988 año
7.564 bn
+1.157 bn
18.06%
1 ene 1989 año
10.755 bn
+3.191 bn
42.2%
1 ene 1990 año
11.664 bn
+908.791 millones
8.45%
1 ene 1991 año
9.234 bn
-2.429 bn
-20.83%
1 ene 1992 año
-1.76 bn
-10.994 bn
-119.06%
1 ene 1993 año
-4.385 bn
-2.625 bn
149.17%
1 ene 1994 año
-2.547 bn
+1.838 bn
-41.92%
1 ene 1995 año
1.159 bn
+3.706 bn
-145.51%
1 ene 1996 año
8.574 bn
+7.415 bn
639.67%
1 ene 1997 año
8.227 bn
-347.134 millones
-4.05%
1 ene 1998 año
12.221 bn
+3.994 bn
48.55%
1 ene 1999 año
15.363 bn
+3.143 bn
25.72%
1 ene 2000 año
17.319 bn
+1.955 bn
12.73%
1 ene 2001 año
18.742 bn
+1.423 bn
8.22%
1 ene 2002 año
19.062 bn
+319.799 millones
1.71%
1 ene 2003 año
18.995 bn
-67.249 millones
-0.35%
1 ene 2004 año
17.562 bn
-1.433 bn
-7.54%
1 ene 2005 año
23.52 bn
+5.958 bn
33.93%
1 ene 2006 año
21.566 bn
-1.954 bn
-8.31%
1 ene 2007 año
23.199 bn
+1.633 bn
7.57%
1 ene 2008 año
31.919 bn
+8.721 bn
37.59%
1 ene 2009 año
28.792 bn
-3.128 bn
-9.8%
1 ene 2010 año
10.151 bn
-18.641 bn
-64.74%
1 ene 2011 año
11.104 bn
+953.155 millones
9.39%
1 ene 2012 año
10.204 bn
-900.543 millones
-8.11%
1 ene 2013 año
4.418 bn
-5.785 bn
-56.7%
1 ene 2014 año
1.188 bn
-3.23 bn
-73.11%
1 ene 2015 año
-22.062 millones
-1.21 bn
-101.86%
Ranking de los países por los datos estadísticos actuales


Comentarios: