29
/es/
es
AIzaSyAYiBZKx7MnpbEhh9jyipgxe19OcubqV5w
April 1, 2024
68980
Antigua and Barbuda
ATG
true
2
1
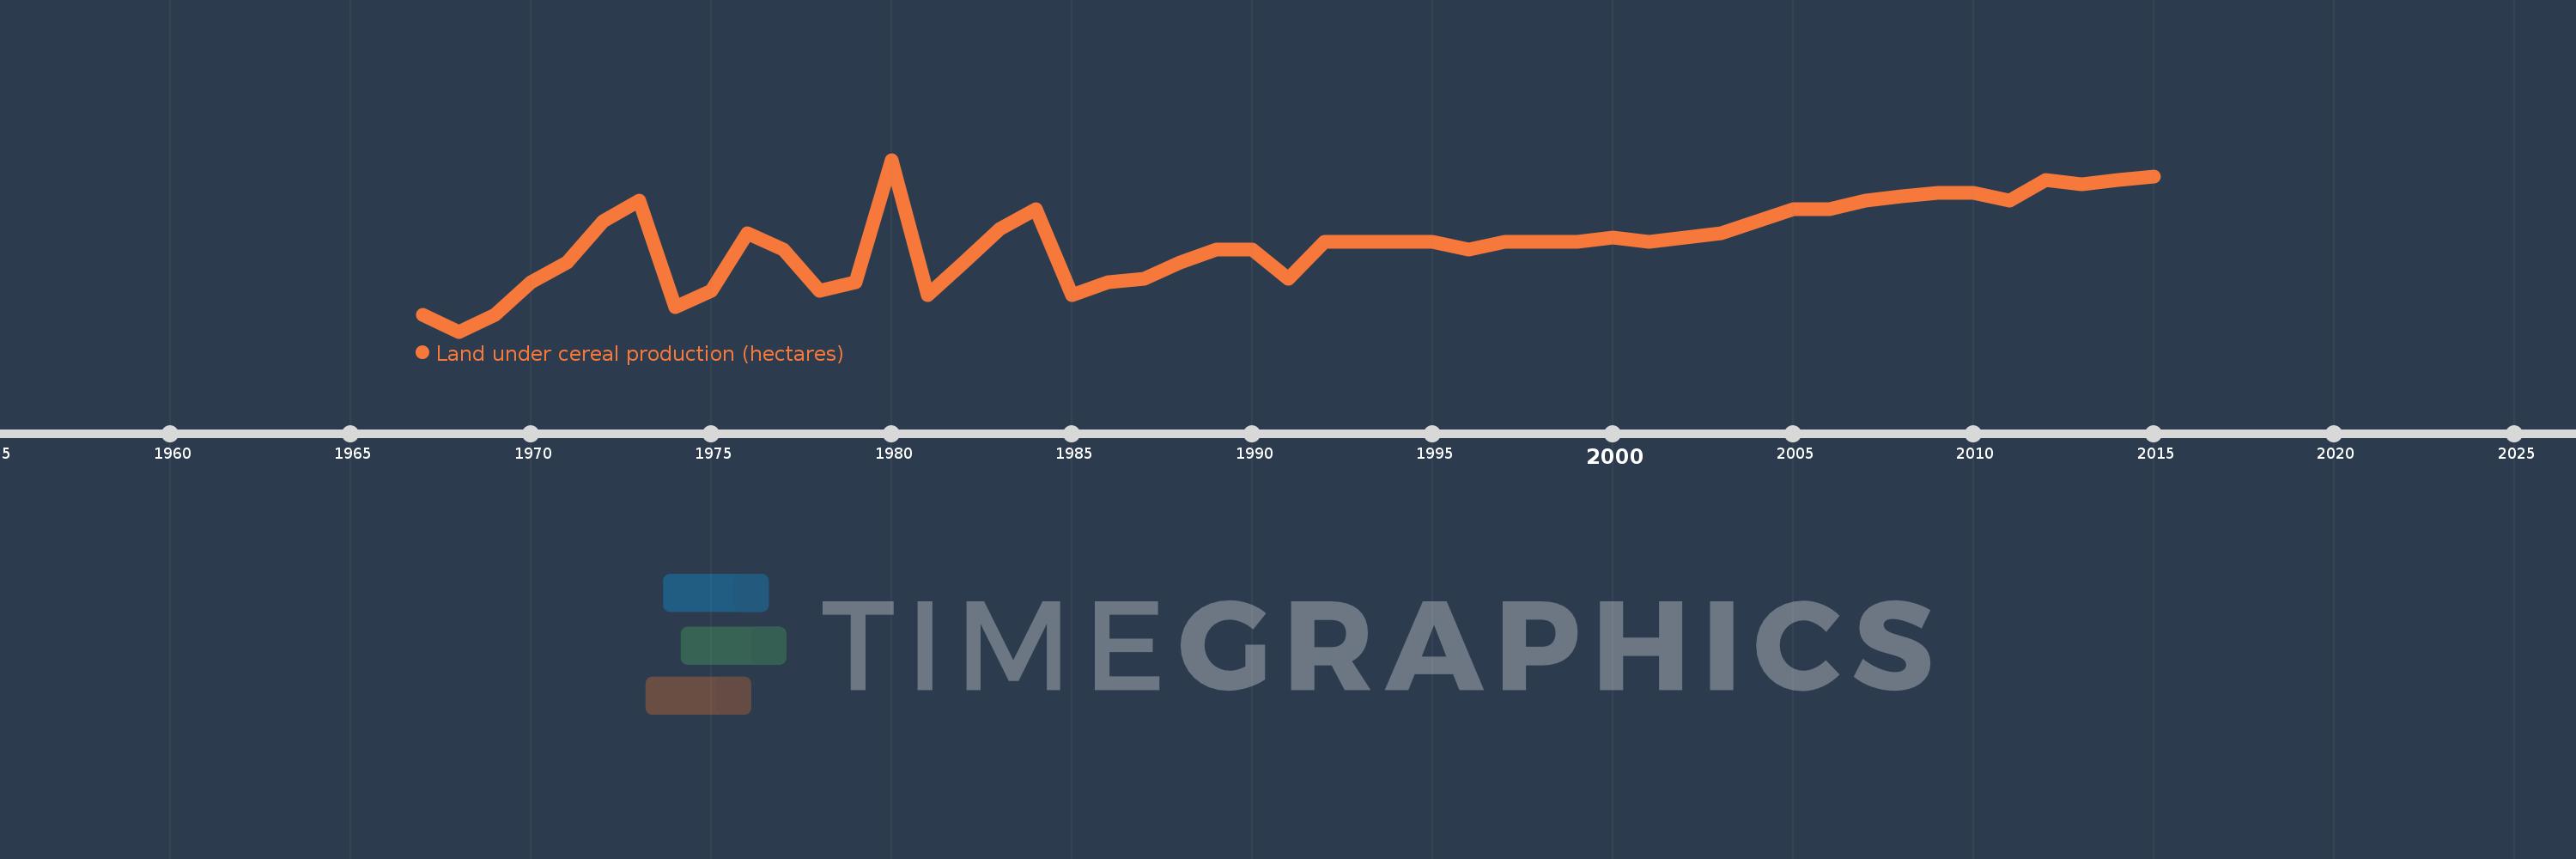
Land under cereal production (hectares)
2015,2014,2013,2012,2011,2010,2009,2008,2007,2006,2005,2004,2003,2002,2001,2000,1999,1998,1997,1996,1995,1994,1993,1992,1991,1990,1989,1988,1987,1986,1985,1984,1983,1982,1981,1980,1979,1978,1977,1976,1975,1974,1973,1972,1971,1970,1969,1968,1967
Estas estadísticas en otros países:
AfghanistanAlbaniaAlgeriaAngolaAntigua and BarbudaArab WorldArgentinaArmeniaAustraliaAustriaAzerbaijanBahamas, TheBangladeshBarbadosBelarusBelgiumBelizeBeninBhutanBoliviaBosnia and HerzegovinaBotswanaBrazilBrunei DarussalamBulgariaBurkina FasoBurundiCabo VerdeCambodiaCameroonCanadaCaribbean small statesCentral African RepublicCentral Europe and the BalticsChadChileChinaColombiaComorosCongo, Dem. Rep.Congo, Rep.Costa RicaCote d'IvoireCroatiaCubaCyprusCzech RepublicDenmarkDjiboutiDominicaDominican RepublicEarly-demographic dividendEast Asia & PacificEast Asia & Pacific (excluding high income)East Asia & Pacific (IDA & IBRD countries)EcuadorEgypt, Arab Rep.El SalvadorEritreaEstoniaEthiopiaEuro areaEurope & Central AsiaEurope & Central Asia (excluding high income)Europe & Central Asia (IDA & IBRD countries)European UnionFijiFinlandFragile and conflict affected situationsFranceGabonGambia, TheGeorgiaGermanyGhanaGreeceGrenadaGuamGuatemalaGuineaGuinea-BissauGuyanaHaitiHeavily indebted poor countries (HIPC)High incomeHondurasHong Kong SAR, ChinaHungaryIBRD onlyIDA & IBRD totalIDA blendIDA onlyIDA totalIndiaIndonesiaIran, Islamic Rep.IraqIrelandIsraelItalyJamaicaJapanJordanKazakhstanKenyaKorea, Dem. People’s Rep.Korea, Rep.KuwaitKyrgyz RepublicLao PDRLate-demographic dividendLatin America & Caribbean Latin America & Caribbean (excluding high income)Latin America & the Caribbean (IDA & IBRD countries)LatviaLeast developed countries: UN classificationLebanonLesothoLiberiaLibyaLithuaniaLow & middle incomeLow incomeLower middle incomeLuxembourgMacedonia, FYRMadagascarMalawiMalaysiaMaldivesMaliMaltaMauritaniaMauritiusMexicoMicronesia, Fed. Sts.Middle East & North AfricaMiddle East & North Africa (excluding high income)Middle East & North Africa (IDA & IBRD countries)Middle incomeMoldovaMongoliaMontenegroMoroccoMozambiqueMyanmarNamibiaNepalNetherlandsNew CaledoniaNew ZealandNicaraguaNigerNigeriaNorth AmericaNorwayOECD membersOmanOther small statesPacific island small statesPakistanPanamaPapua New GuineaParaguayPeruPhilippinesPolandPortugalPost-demographic dividendPre-demographic dividendPuerto RicoQatarRomaniaRussian FederationRwandaSao Tome and PrincipeSaudi ArabiaSenegalSerbiaSierra LeoneSlovak RepublicSloveniaSmall statesSolomon IslandsSomaliaSouth AfricaSouth AsiaSouth Asia (IDA & IBRD)South SudanSpainSri LankaSt. LuciaSt. Vincent and the GrenadinesSub-Saharan Africa Sub-Saharan Africa (excluding high income)Sub-Saharan Africa (IDA & IBRD countries)SudanSurinameSwazilandSwedenSwitzerlandSyrian Arab RepublicTajikistanTanzaniaThailandTimor-LesteTogoTrinidad and TobagoTunisiaTurkeyTurkmenistanUgandaUkraineUnited Arab EmiratesUnited KingdomUnited StatesUpper middle incomeUruguayUzbekistanVanuatuVenezuela, RBVietnamWest Bank and GazaWorldYemen, Rep.ZambiaZimbabwe línea de tiempo (timeline):
En esta escala de tiempo se presenta un gráfico de 1967 y 2015 de Antigua and Barbuda. Los datos de 1966 están ausentes. El número de observaciones reales por fecha: 49.
Fuente (nombre):
Indicadores del desarrollo mundial
Fuente (organización):
Food and Agriculture Organization, electronic files and web site.
Categorías:
Agriculture & Rural Development
Se ha actualizado:
23 abr 2017 año
Los indicadores de los cambios de valor en los últimos años
Máximo:
50.0
1 ene 1980 año
A la fecha de observación
Valor
Cambio absoluto
El cambio con respecto al valor anterior
1 ene 1967 año
12.0
+12.0
0.0%
1 ene 1968 año
8.0
-4.0
-33.33%
1 ene 1969 año
12.0
+4.0
50.0%
1 ene 1970 año
20.0
+8.0
66.67%
1 ene 1971 año
25.0
+5.0
25.0%
1 ene 1972 año
35.0
+10.0
40.0%
1 ene 1973 año
40.0
+5.0
14.29%
1 ene 1974 año
14.0
-26.0
-65.0%
1 ene 1975 año
18.0
+4.0
28.57%
1 ene 1976 año
32.0
+14.0
77.78%
1 ene 1977 año
28.0
-4.0
-12.5%
1 ene 1978 año
18.0
-10.0
-35.71%
1 ene 1979 año
20.0
+2.0
11.11%
1 ene 1980 año
50.0
+30.0
150.0%
1 ene 1981 año
17.0
-33.0
-66.0%
1 ene 1982 año
25.0
+8.0
47.06%
1 ene 1983 año
33.0
+8.0
32.0%
1 ene 1984 año
38.0
+5.0
15.15%
1 ene 1985 año
17.0
-21.0
-55.26%
1 ene 1986 año
20.0
+3.0
17.65%
1 ene 1987 año
21.0
+1.0
5.0%
1 ene 1988 año
25.0
+4.0
19.05%
1 ene 1989 año
28.0
+3.0
12.0%
1 ene 1990 año
28.0
0.0
0.0%
1 ene 1991 año
21.0
-7.0
-25.0%
1 ene 1992 año
30.0
+9.0
42.86%
1 ene 1993 año
30.0
0.0
0.0%
1 ene 1994 año
30.0
0.0
0.0%
1 ene 1995 año
30.0
0.0
0.0%
1 ene 1996 año
28.0
-2.0
-6.67%
1 ene 1997 año
30.0
+2.0
7.14%
1 ene 1998 año
30.0
0.0
0.0%
1 ene 1999 año
30.0
0.0
0.0%
1 ene 2000 año
31.0
+1.0
3.33%
1 ene 2001 año
30.0
-1.0
-3.23%
1 ene 2002 año
31.0
+1.0
3.33%
1 ene 2003 año
32.0
+1.0
3.23%
1 ene 2004 año
35.0
+3.0
9.38%
1 ene 2005 año
38.0
+3.0
8.57%
1 ene 2006 año
38.0
0.0
0.0%
1 ene 2007 año
40.0
+2.0
5.26%
1 ene 2008 año
41.0
+1.0
2.5%
1 ene 2009 año
42.0
+1.0
2.44%
1 ene 2010 año
42.0
0.0
0.0%
1 ene 2011 año
40.0
-2.0
-4.76%
1 ene 2012 año
45.0
+5.0
12.5%
1 ene 2013 año
44.0
-1.0
-2.22%
1 ene 2014 año
45.0
+1.0
2.27%
1 ene 2015 año
46.0
+1.0
2.22%
Ranking de los países por los datos estadísticos actuales


Comentarios: