29
/es/
es
AIzaSyAYiBZKx7MnpbEhh9jyipgxe19OcubqV5w
April 1, 2024
189193
Maldives
MDV
true
2
1
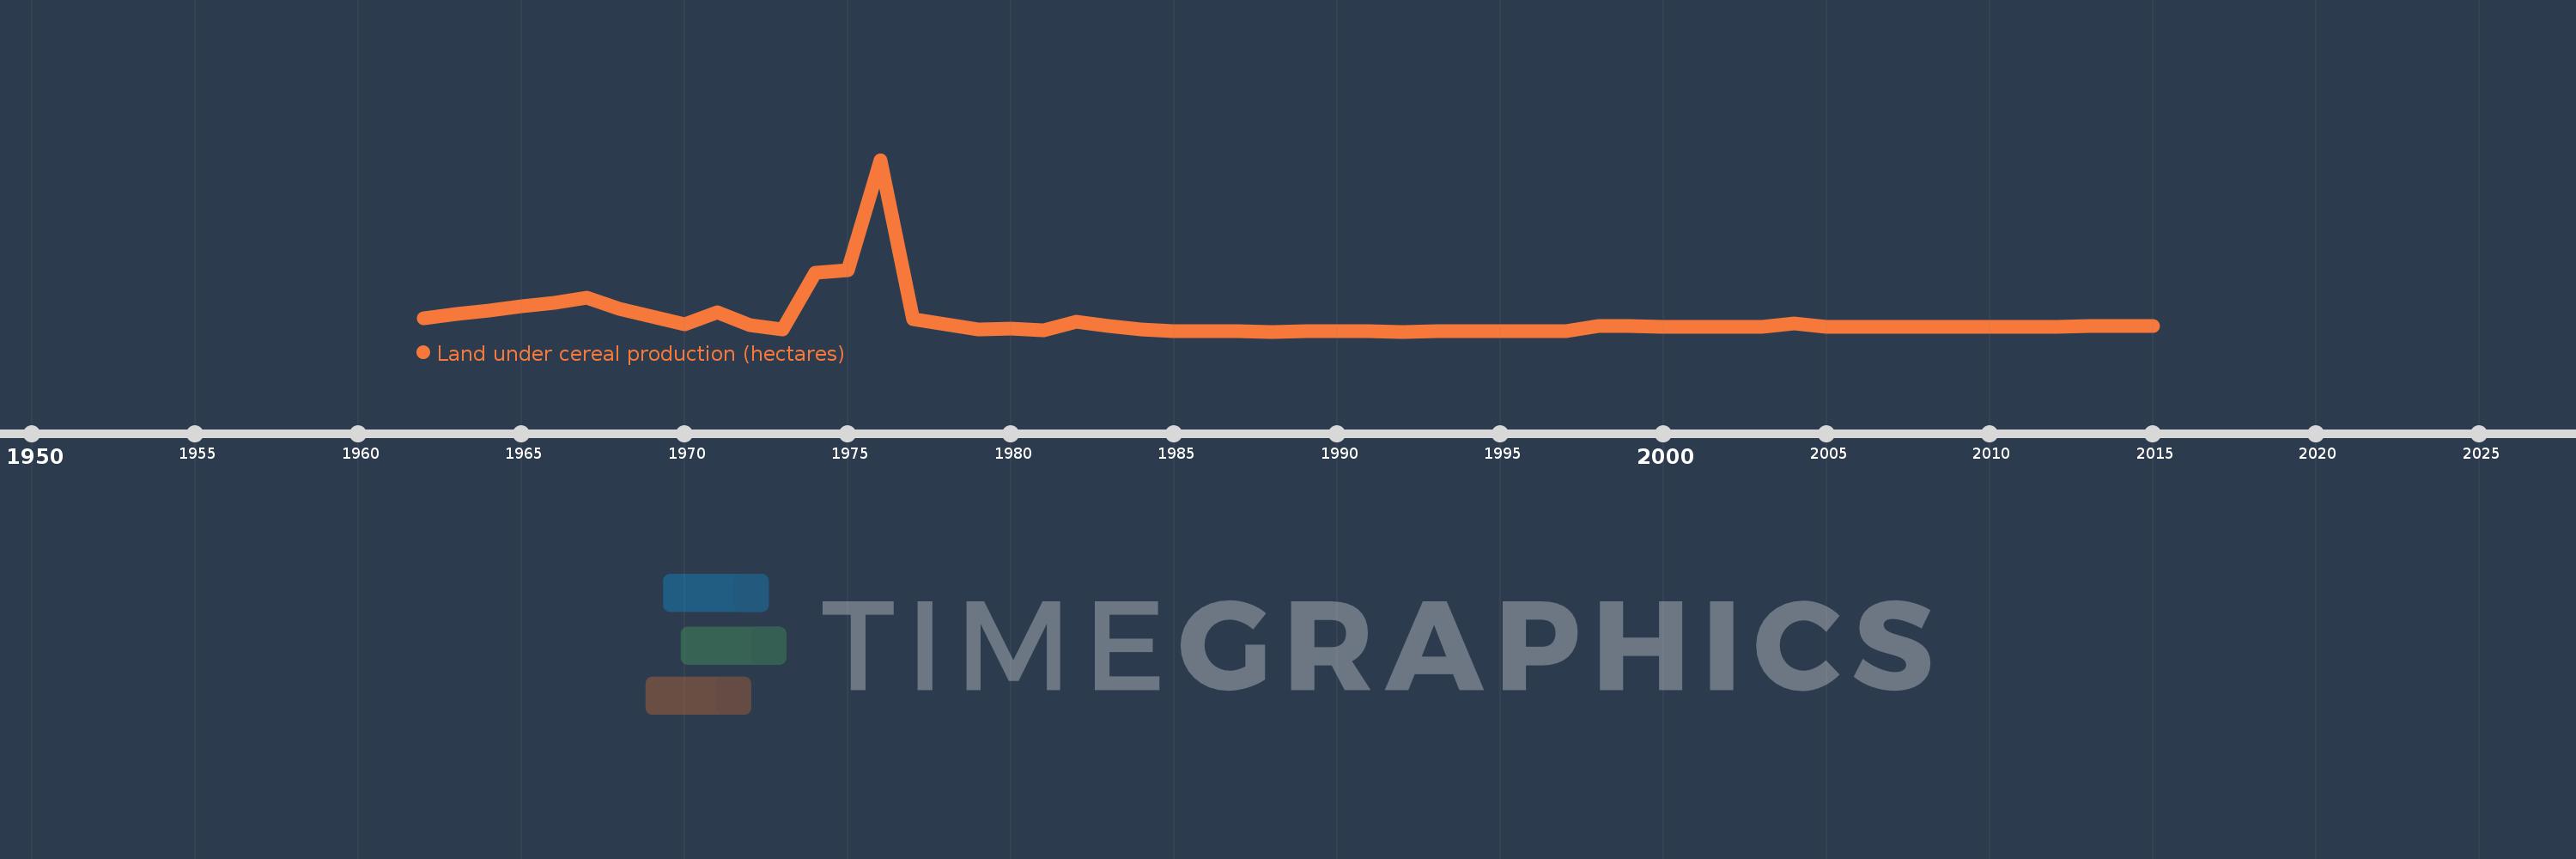
Land under cereal production (hectares)
2015,2014,2013,2012,2011,2010,2009,2008,2007,2006,2005,2004,2003,2002,2001,2000,1999,1998,1997,1996,1995,1994,1993,1992,1991,1990,1989,1988,1987,1986,1985,1984,1983,1982,1981,1980,1979,1978,1977,1976,1975,1974,1973,1972,1971,1970,1969,1968,1967,1966,1965,1964,1963,1962
Estas estadísticas en otros países:
AfghanistanAlbaniaAlgeriaAngolaAntigua and BarbudaArab WorldArgentinaArmeniaAustraliaAustriaAzerbaijanBahamas, TheBangladeshBarbadosBelarusBelgiumBelizeBeninBhutanBoliviaBosnia and HerzegovinaBotswanaBrazilBrunei DarussalamBulgariaBurkina FasoBurundiCabo VerdeCambodiaCameroonCanadaCaribbean small statesCentral African RepublicCentral Europe and the BalticsChadChileChinaColombiaComorosCongo, Dem. Rep.Congo, Rep.Costa RicaCote d'IvoireCroatiaCubaCyprusCzech RepublicDenmarkDjiboutiDominicaDominican RepublicEarly-demographic dividendEast Asia & PacificEast Asia & Pacific (excluding high income)East Asia & Pacific (IDA & IBRD countries)EcuadorEgypt, Arab Rep.El SalvadorEritreaEstoniaEthiopiaEuro areaEurope & Central AsiaEurope & Central Asia (excluding high income)Europe & Central Asia (IDA & IBRD countries)European UnionFijiFinlandFragile and conflict affected situationsFranceGabonGambia, TheGeorgiaGermanyGhanaGreeceGrenadaGuamGuatemalaGuineaGuinea-BissauGuyanaHaitiHeavily indebted poor countries (HIPC)High incomeHondurasHong Kong SAR, ChinaHungaryIBRD onlyIDA & IBRD totalIDA blendIDA onlyIDA totalIndiaIndonesiaIran, Islamic Rep.IraqIrelandIsraelItalyJamaicaJapanJordanKazakhstanKenyaKorea, Dem. People’s Rep.Korea, Rep.KuwaitKyrgyz RepublicLao PDRLate-demographic dividendLatin America & Caribbean Latin America & Caribbean (excluding high income)Latin America & the Caribbean (IDA & IBRD countries)LatviaLeast developed countries: UN classificationLebanonLesothoLiberiaLibyaLithuaniaLow & middle incomeLow incomeLower middle incomeLuxembourgMacedonia, FYRMadagascarMalawiMalaysiaMaldivesMaliMaltaMauritaniaMauritiusMexicoMicronesia, Fed. Sts.Middle East & North AfricaMiddle East & North Africa (excluding high income)Middle East & North Africa (IDA & IBRD countries)Middle incomeMoldovaMongoliaMontenegroMoroccoMozambiqueMyanmarNamibiaNepalNetherlandsNew CaledoniaNew ZealandNicaraguaNigerNigeriaNorth AmericaNorwayOECD membersOmanOther small statesPacific island small statesPakistanPanamaPapua New GuineaParaguayPeruPhilippinesPolandPortugalPost-demographic dividendPre-demographic dividendPuerto RicoQatarRomaniaRussian FederationRwandaSao Tome and PrincipeSaudi ArabiaSenegalSerbiaSierra LeoneSlovak RepublicSloveniaSmall statesSolomon IslandsSomaliaSouth AfricaSouth AsiaSouth Asia (IDA & IBRD)South SudanSpainSri LankaSt. LuciaSt. Vincent and the GrenadinesSub-Saharan Africa Sub-Saharan Africa (excluding high income)Sub-Saharan Africa (IDA & IBRD countries)SudanSurinameSwazilandSwedenSwitzerlandSyrian Arab RepublicTajikistanTanzaniaThailandTimor-LesteTogoTrinidad and TobagoTunisiaTurkeyTurkmenistanUgandaUkraineUnited Arab EmiratesUnited KingdomUnited StatesUpper middle incomeUruguayUzbekistanVanuatuVenezuela, RBVietnamWest Bank and GazaWorldYemen, Rep.ZambiaZimbabwe línea de tiempo (timeline):
En esta escala de tiempo se presenta un gráfico de 1962 y 2015 de Maldives. Los datos de 1961 están ausentes. El número de observaciones reales por fecha: 54.
Fuente (nombre):
Indicadores del desarrollo mundial
Fuente (organización):
Food and Agriculture Organization, electronic files and web site.
Categorías:
Agriculture & Rural Development
Se ha actualizado:
23 abr 2017 año
Los indicadores de los cambios de valor en los últimos años
Máximo:
2.326 mil
1 ene 1976 año
A la fecha de observación
Valor
Cambio absoluto
El cambio con respecto al valor anterior
1 ene 1962 año
179.0
+179.0
0.0%
1 ene 1963 año
240.0
+61.0
34.08%
1 ene 1964 año
292.0
+52.0
21.67%
1 ene 1965 año
343.0
+51.0
17.47%
1 ene 1966 año
394.0
+51.0
14.87%
1 ene 1967 año
465.0
+71.0
18.02%
1 ene 1968 año
308.0
-157.0
-33.76%
1 ene 1969 año
204.0
-104.0
-33.77%
1 ene 1970 año
106.0
-98.0
-48.04%
1 ene 1971 año
269.0
+163.0
153.77%
1 ene 1972 año
92.0
-177.0
-65.8%
1 ene 1973 año
32.0
-60.0
-65.22%
1 ene 1974 año
805.0
+773.0
2.42 mil%
1 ene 1975 año
833.0
+28.0
3.48%
1 ene 1976 año
2.326 mil
+1.493 mil
179.23%
1 ene 1977 año
176.0
-2.15 mil
-92.43%
1 ene 1978 año
104.0
-72.0
-40.91%
1 ene 1979 año
34.0
-70.0
-67.31%
1 ene 1980 año
50.0
+16.0
47.06%
1 ene 1981 año
20.0
-30.0
-60.0%
1 ene 1982 año
133.0
+113.0
565.0%
1 ene 1983 año
77.0
-56.0
-42.11%
1 ene 1984 año
35.0
-42.0
-54.55%
1 ene 1985 año
5.0
-30.0
-85.71%
1 ene 1986 año
5.0
0.0
0.0%
1 ene 1987 año
5.0
0.0
0.0%
1 ene 1988 año
4.0
-1.0
-20.0%
1 ene 1989 año
6.0
+2.0
50.0%
1 ene 1990 año
8.0
+2.0
33.33%
1 ene 1991 año
7.0
-1.0
-12.5%
1 ene 1992 año
4.0
-3.0
-42.86%
1 ene 1993 año
8.0
+4.0
100.0%
1 ene 1994 año
10.0
+2.0
25.0%
1 ene 1995 año
11.0
+1.0
10.0%
1 ene 1996 año
11.0
0.0
0.0%
1 ene 1997 año
9.0
-2.0
-18.18%
1 ene 1998 año
79.0
+70.0
777.78%
1 ene 1999 año
75.0
-4.0
-5.06%
1 ene 2000 año
71.0
-4.0
-5.33%
1 ene 2001 año
68.0
-3.0
-4.23%
1 ene 2002 año
68.0
0.0
0.0%
1 ene 2003 año
66.0
-2.0
-2.94%
1 ene 2004 año
118.0
+52.0
78.79%
1 ene 2005 año
67.0
-51.0
-43.22%
1 ene 2006 año
68.0
+1.0
1.49%
1 ene 2007 año
70.0
+2.0
2.94%
1 ene 2008 año
70.0
0.0
0.0%
1 ene 2009 año
70.0
0.0
0.0%
1 ene 2010 año
68.0
-2.0
-2.86%
1 ene 2011 año
72.0
+4.0
5.88%
1 ene 2012 año
72.0
0.0
0.0%
1 ene 2013 año
74.0
+2.0
2.78%
1 ene 2014 año
77.0
+3.0
4.05%
1 ene 2015 año
79.0
+2.0
2.6%
Ranking de los países por los datos estadísticos actuales


Comentarios: