29
/es/
es
AIzaSyAYiBZKx7MnpbEhh9jyipgxe19OcubqV5w
April 1, 2024
62793
World
WLD
false
2
1
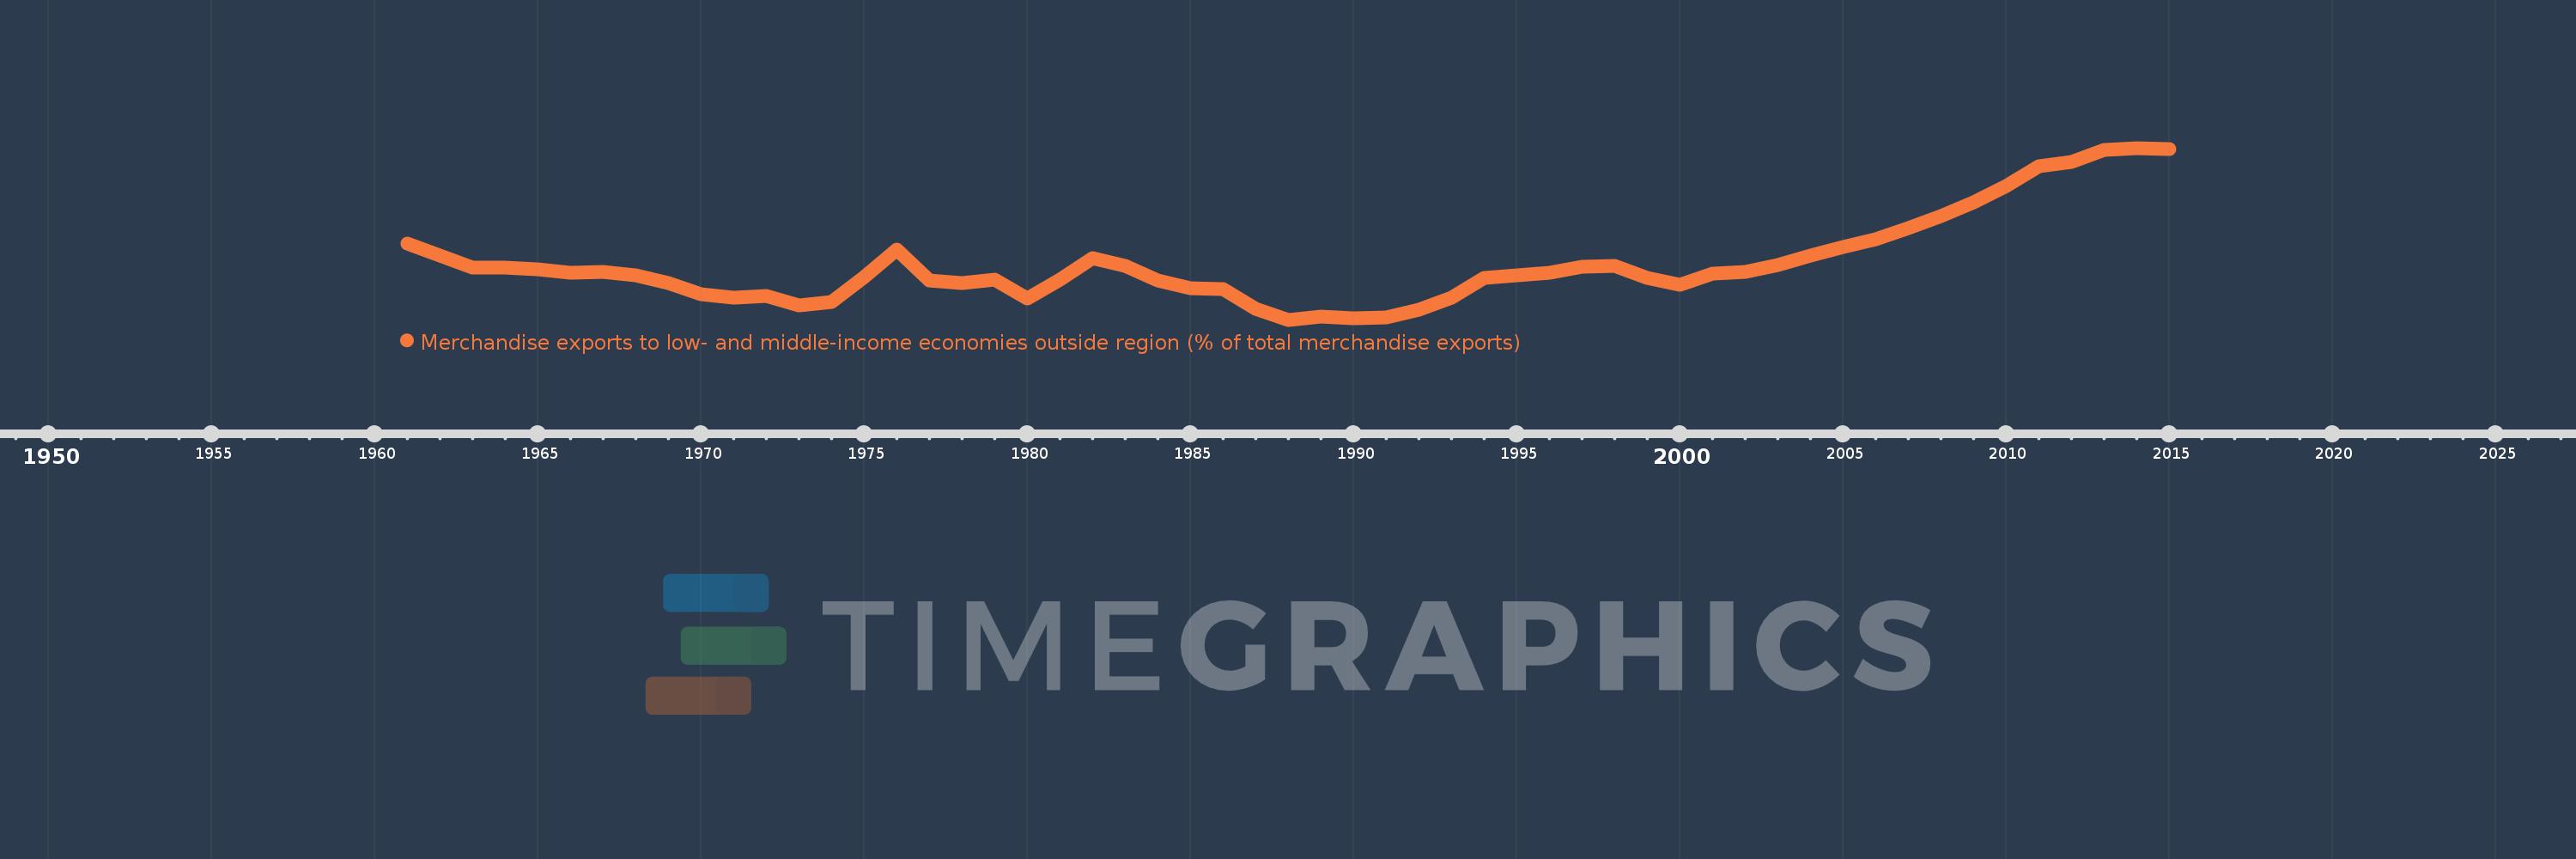
Merchandise exports to low- and middle-income economies outside region (% of total merchandise exports)
2015,2014,2013,2012,2011,2010,2009,2008,2007,2006,2005,2004,2003,2002,2001,2000,1999,1998,1997,1996,1995,1994,1993,1992,1991,1990,1989,1988,1987,1986,1985,1984,1983,1982,1981,1980,1979,1978,1977,1976,1975,1974,1973,1972,1971,1970,1969,1968,1967,1966,1965,1964,1963,1962,1961
Estas estadísticas en otros países:
AfghanistanAlbaniaAlgeriaAngolaArab WorldArgentinaArmeniaArubaAustraliaAustriaAzerbaijanBahamas, TheBahrainBangladeshBarbadosBelarusBelgiumBelizeBeninBermudaBoliviaBrazilBrunei DarussalamBulgariaBurundiCabo VerdeCambodiaCameroonCanadaCaribbean small statesCentral African RepublicCentral Europe and the BalticsChileChinaColombiaCongo, Dem. Rep.Congo, Rep.Costa RicaCote d'IvoireCroatiaCubaCyprusCzech RepublicDenmarkDominicaDominican RepublicEarly-demographic dividendEast Asia & PacificEast Asia & Pacific (excluding high income)East Asia & Pacific (IDA & IBRD countries)EcuadorEgypt, Arab Rep.El SalvadorEstoniaEthiopiaEuro areaEurope & Central AsiaEurope & Central Asia (excluding high income)Europe & Central Asia (IDA & IBRD countries)European UnionFijiFinlandFragile and conflict affected situationsFranceGabonGambia, TheGeorgiaGermanyGhanaGreeceGreenlandGuatemalaGuineaGuyanaHaitiHeavily indebted poor countries (HIPC)High incomeHondurasHong Kong SAR, ChinaHungaryIBRD onlyIcelandIDA & IBRD totalIDA blendIDA onlyIDA totalIndiaIndonesiaIran, Islamic Rep.IraqIrelandIsraelItalyJamaicaJapanJordanKazakhstanKenyaKorea, Dem. People’s Rep.Korea, Rep.KuwaitLao PDRLate-demographic dividendLatin America & Caribbean Latin America & Caribbean (excluding high income)Latin America & the Caribbean (IDA & IBRD countries)LatviaLeast developed countries: UN classificationLebanonLiberiaLibyaLithuaniaLow & middle incomeLow incomeLower middle incomeLuxembourgMacao SAR, ChinaMacedonia, FYRMadagascarMalawiMalaysiaMaliMaltaMauritaniaMauritiusMexicoMiddle East & North AfricaMiddle East & North Africa (excluding high income)Middle East & North Africa (IDA & IBRD countries)Middle incomeMoldovaMongoliaMontenegroMoroccoMozambiqueMyanmarNetherlandsNew CaledoniaNew ZealandNicaraguaNigerNigeriaNorth AmericaNorwayOECD membersOmanOther small statesPacific island small statesPakistanPanamaPapua New GuineaParaguayPeruPhilippinesPolandPortugalPost-demographic dividendPre-demographic dividendQatarRomaniaRussian FederationRwandaSamoaSaudi ArabiaSenegalSerbiaSeychellesSierra LeoneSingaporeSlovak RepublicSloveniaSmall statesSomaliaSouth AfricaSouth AsiaSouth Asia (IDA & IBRD)SpainSri LankaSt. LuciaSt. Vincent and the GrenadinesSub-Saharan Africa Sub-Saharan Africa (excluding high income)Sub-Saharan Africa (IDA & IBRD countries)SudanSurinameSwedenSwitzerlandSyrian Arab RepublicTanzaniaThailandTogoTrinidad and TobagoTunisiaTurkeyUgandaUkraineUnited Arab EmiratesUnited KingdomUnited StatesUpper middle incomeUruguayVenezuela, RBVietnamWorldYemen, Rep.ZambiaZimbabwe línea de tiempo (timeline):
En esta escala de tiempo se presenta un gráfico de 1961 y 2015 de World. Los datos de 1960 están ausentes. El número de observaciones reales por fecha: 55.
Fuente (nombre):
Indicadores del desarrollo mundial
Fuente (organización):
World Bank staff estimates based data from International Monetary Fund's Direction of Trade database.
Categorías:
Private Sector, Trade
Se ha actualizado:
23 abr 2017 año
Los indicadores de los cambios de valor en los últimos años
Mínimo:
11.809
1 ene 1988 año
Máximo:
25.166
1 ene 2014 año
A la fecha de observación
Valor
Cambio absoluto
El cambio con respecto al valor anterior
1 ene 1961 año
17.746
+17.746
0.0%
1 ene 1962 año
16.822
-0.924
-5.21%
1 ene 1963 año
15.883
-0.938
-5.58%
1 ene 1964 año
15.837
-0.046
-0.29%
1 ene 1965 año
15.732
-0.105
-0.66%
1 ene 1966 año
15.486
-0.246
-1.57%
1 ene 1967 año
15.531
+0.045
0.29%
1 ene 1968 año
15.259
-0.272
-1.75%
1 ene 1969 año
14.667
-0.593
-3.88%
1 ene 1970 año
13.783
-0.884
-6.03%
1 ene 1971 año
13.527
-0.256
-1.85%
1 ene 1972 año
13.663
+0.136
1.0%
1 ene 1973 año
12.938
-0.725
-5.31%
1 ene 1974 año
13.18
+0.242
1.87%
1 ene 1975 año
15.108
+1.927
14.62%
1 ene 1976 año
17.265
+2.157
14.28%
1 ene 1977 año
14.845
-2.42
-14.02%
1 ene 1978 año
14.67
-0.175
-1.18%
1 ene 1979 año
14.897
+0.227
1.55%
1 ene 1980 año
13.457
-1.439
-9.66%
1 ene 1981 año
14.901
+1.444
10.73%
1 ene 1982 año
16.566
+1.665
11.18%
1 ene 1983 año
15.996
-0.57
-3.44%
1 ene 1984 año
14.869
-1.127
-7.05%
1 ene 1985 año
14.275
-0.594
-4.0%
1 ene 1986 año
14.215
-0.06
-0.42%
1 ene 1987 año
12.642
-1.573
-11.06%
1 ene 1988 año
11.809
-0.833
-6.59%
1 ene 1989 año
12.037
+0.229
1.94%
1 ene 1990 año
11.927
-0.11
-0.91%
1 ene 1991 año
12.006
+0.078
0.66%
1 ene 1992 año
12.562
+0.556
4.63%
1 ene 1993 año
13.504
+0.942
7.5%
1 ene 1994 año
15.038
+1.534
11.36%
1 ene 1995 año
15.273
+0.234
1.56%
1 ene 1996 año
15.495
+0.223
1.46%
1 ene 1997 año
15.919
+0.424
2.74%
1 ene 1998 año
15.983
+0.063
0.4%
1 ene 1999 año
15.079
-0.903
-5.65%
1 ene 2000 año
14.541
-0.539
-3.57%
1 ene 2001 año
15.372
+0.831
5.72%
1 ene 2002 año
15.524
+0.152
0.99%
1 ene 2003 año
16.091
+0.567
3.65%
1 ene 2004 año
16.791
+0.699
4.35%
1 ene 2005 año
17.477
+0.686
4.09%
1 ene 2006 año
18.061
+0.584
3.34%
1 ene 2007 año
18.947
+0.886
4.91%
1 ene 2008 año
19.896
+0.948
5.01%
1 ene 2009 año
20.961
+1.065
5.35%
1 ene 2010 año
22.209
+1.248
5.95%
1 ene 2011 año
23.716
+1.507
6.79%
1 ene 2012 año
24.106
+0.39
1.64%
1 ene 2013 año
25.008
+0.902
3.74%
1 ene 2014 año
25.166
+0.157
0.63%
1 ene 2015 año
25.053
-0.112
-0.45%
Ranking de los países por los datos estadísticos actuales


Comentarios: