29
/es/
es
AIzaSyAYiBZKx7MnpbEhh9jyipgxe19OcubqV5w
April 1, 2024
41667
Latin America & Caribbean
LCN
false
2
1
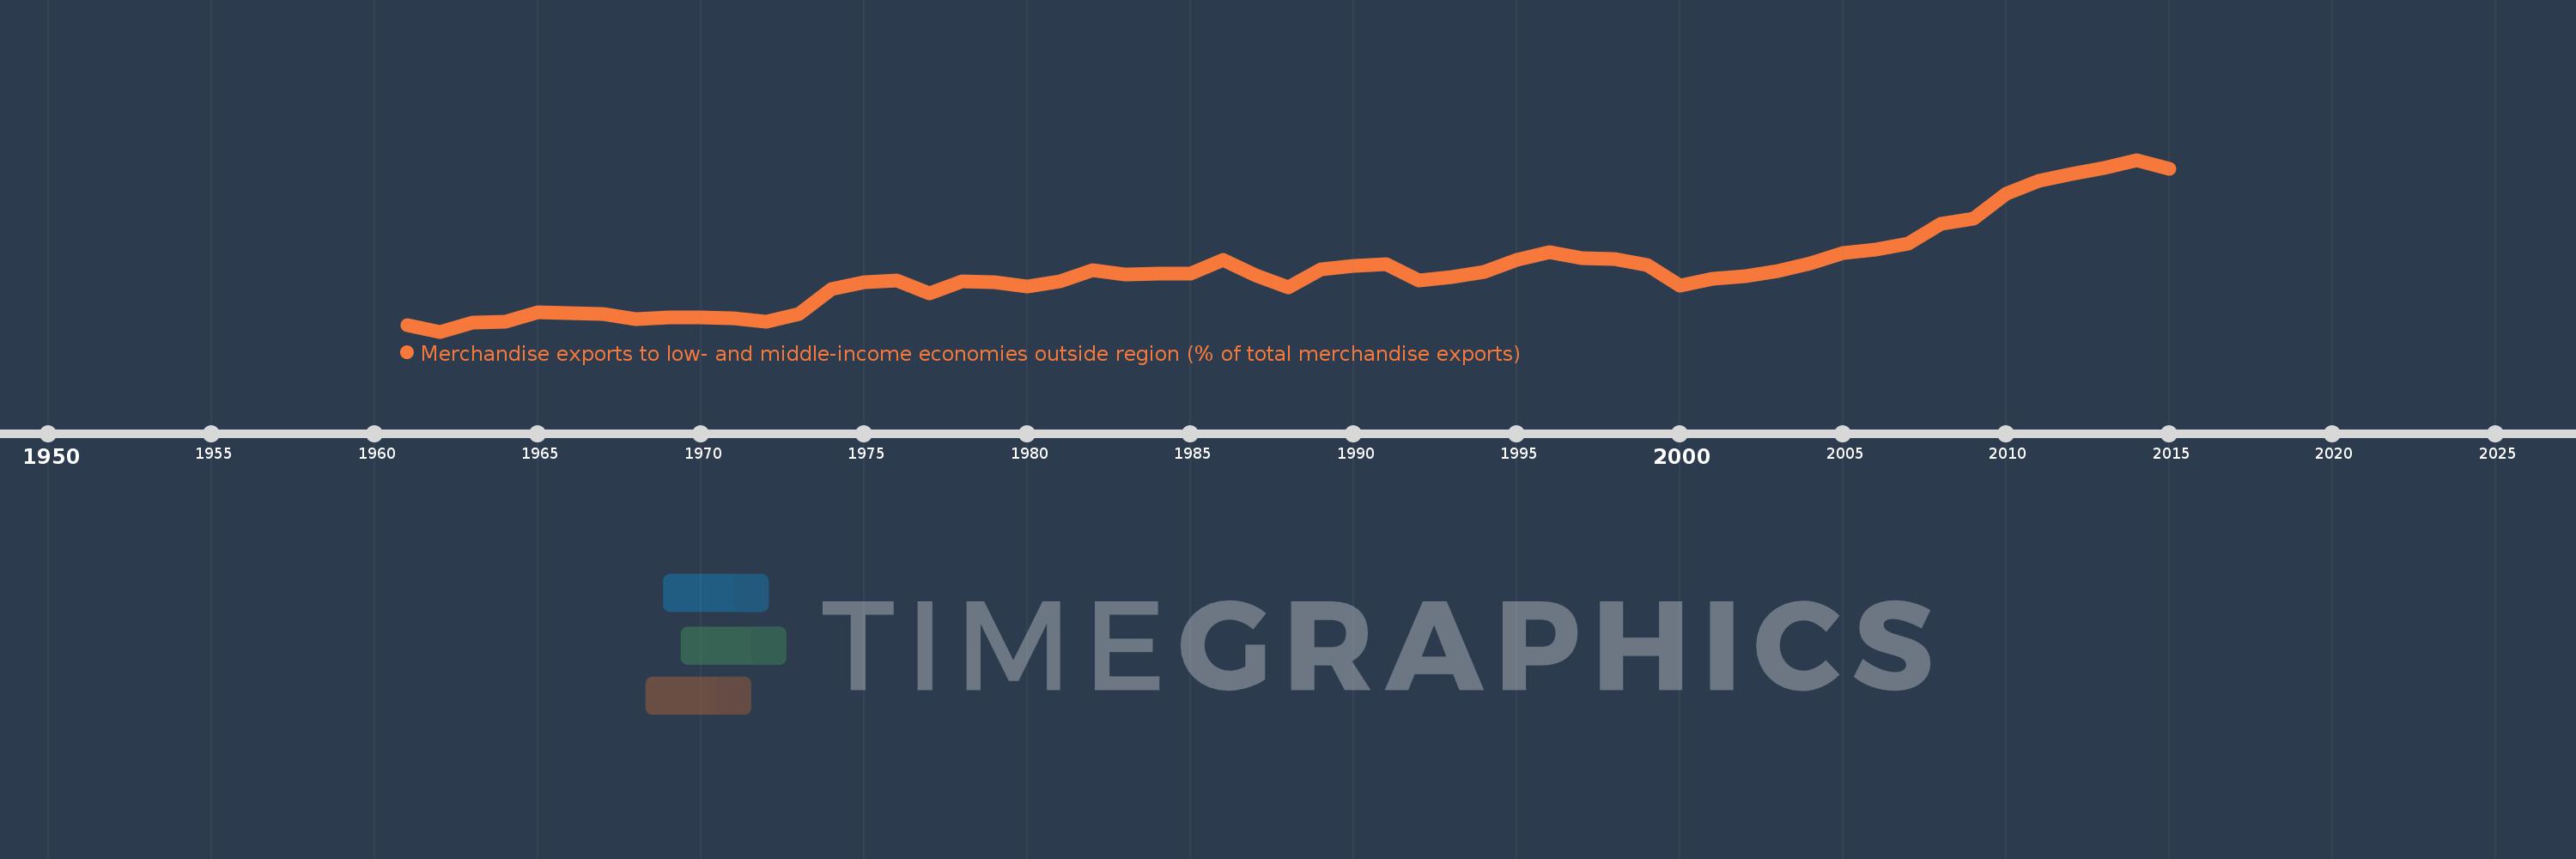
Merchandise exports to low- and middle-income economies outside region (% of total merchandise exports)
2015,2014,2013,2012,2011,2010,2009,2008,2007,2006,2005,2004,2003,2002,2001,2000,1999,1998,1997,1996,1995,1994,1993,1992,1991,1990,1989,1988,1987,1986,1985,1984,1983,1982,1981,1980,1979,1978,1977,1976,1975,1974,1973,1972,1971,1970,1969,1968,1967,1966,1965,1964,1963,1962,1961
Estas estadísticas en otros países:
AfghanistanAlbaniaAlgeriaAngolaArab WorldArgentinaArmeniaArubaAustraliaAustriaAzerbaijanBahamas, TheBahrainBangladeshBarbadosBelarusBelgiumBelizeBeninBermudaBoliviaBrazilBrunei DarussalamBulgariaBurundiCabo VerdeCambodiaCameroonCanadaCaribbean small statesCentral African RepublicCentral Europe and the BalticsChileChinaColombiaCongo, Dem. Rep.Congo, Rep.Costa RicaCote d'IvoireCroatiaCubaCyprusCzech RepublicDenmarkDominicaDominican RepublicEarly-demographic dividendEast Asia & PacificEast Asia & Pacific (excluding high income)East Asia & Pacific (IDA & IBRD countries)EcuadorEgypt, Arab Rep.El SalvadorEstoniaEthiopiaEuro areaEurope & Central AsiaEurope & Central Asia (excluding high income)Europe & Central Asia (IDA & IBRD countries)European UnionFijiFinlandFragile and conflict affected situationsFranceGabonGambia, TheGeorgiaGermanyGhanaGreeceGreenlandGuatemalaGuineaGuyanaHaitiHeavily indebted poor countries (HIPC)High incomeHondurasHong Kong SAR, ChinaHungaryIBRD onlyIcelandIDA & IBRD totalIDA blendIDA onlyIDA totalIndiaIndonesiaIran, Islamic Rep.IraqIrelandIsraelItalyJamaicaJapanJordanKazakhstanKenyaKorea, Dem. People’s Rep.Korea, Rep.KuwaitLao PDRLate-demographic dividendLatin America & Caribbean Latin America & Caribbean (excluding high income)Latin America & the Caribbean (IDA & IBRD countries)LatviaLeast developed countries: UN classificationLebanonLiberiaLibyaLithuaniaLow & middle incomeLow incomeLower middle incomeLuxembourgMacao SAR, ChinaMacedonia, FYRMadagascarMalawiMalaysiaMaliMaltaMauritaniaMauritiusMexicoMiddle East & North AfricaMiddle East & North Africa (excluding high income)Middle East & North Africa (IDA & IBRD countries)Middle incomeMoldovaMongoliaMontenegroMoroccoMozambiqueMyanmarNetherlandsNew CaledoniaNew ZealandNicaraguaNigerNigeriaNorth AmericaNorwayOECD membersOmanOther small statesPacific island small statesPakistanPanamaPapua New GuineaParaguayPeruPhilippinesPolandPortugalPost-demographic dividendPre-demographic dividendQatarRomaniaRussian FederationRwandaSamoaSaudi ArabiaSenegalSerbiaSeychellesSierra LeoneSingaporeSlovak RepublicSloveniaSmall statesSomaliaSouth AfricaSouth AsiaSouth Asia (IDA & IBRD)SpainSri LankaSt. LuciaSt. Vincent and the GrenadinesSub-Saharan Africa Sub-Saharan Africa (excluding high income)Sub-Saharan Africa (IDA & IBRD countries)SudanSurinameSwedenSwitzerlandSyrian Arab RepublicTanzaniaThailandTogoTrinidad and TobagoTunisiaTurkeyUgandaUkraineUnited Arab EmiratesUnited KingdomUnited StatesUpper middle incomeUruguayVenezuela, RBVietnamWorldYemen, Rep.ZambiaZimbabwe línea de tiempo (timeline):
En esta escala de tiempo se presenta un gráfico de 1961 y 2015 de Latin America & Caribbean . Los datos de 1960 están ausentes. El número de observaciones reales por fecha: 55.
Fuente (nombre):
Indicadores del desarrollo mundial
Fuente (organización):
World Bank staff estimates based data from International Monetary Fund's Direction of Trade database.
Categorías:
Private Sector, Trade
Se ha actualizado:
23 abr 2017 año
Los indicadores de los cambios de valor en los últimos años
Mínimo:
3.243
1 ene 1962 año
Máximo:
21.922
1 ene 2014 año
A la fecha de observación
Valor
Cambio absoluto
El cambio con respecto al valor anterior
1 ene 1961 año
3.901
+3.901
0.0%
1 ene 1962 año
3.243
-0.658
-16.87%
1 ene 1963 año
4.187
+0.944
29.1%
1 ene 1964 año
4.352
+0.165
3.95%
1 ene 1965 año
5.316
+0.963
22.14%
1 ene 1966 año
5.276
-0.039
-0.74%
1 ene 1967 año
5.117
-0.159
-3.02%
1 ene 1968 año
4.6
-0.517
-10.1%
1 ene 1969 año
4.788
+0.188
4.08%
1 ene 1970 año
4.771
-0.017
-0.37%
1 ene 1971 año
4.712
-0.059
-1.23%
1 ene 1972 año
4.295
-0.417
-8.85%
1 ene 1973 año
5.185
+0.89
20.72%
1 ene 1974 año
7.894
+2.708
52.24%
1 ene 1975 año
8.595
+0.701
8.88%
1 ene 1976 año
8.78
+0.185
2.16%
1 ene 1977 año
7.36
-1.42
-16.18%
1 ene 1978 año
8.683
+1.324
17.98%
1 ene 1979 año
8.62
-0.063
-0.73%
1 ene 1980 año
8.11
-0.51
-5.92%
1 ene 1981 año
8.708
+0.599
7.38%
1 ene 1982 año
9.904
+1.196
13.73%
1 ene 1983 año
9.469
-0.435
-4.39%
1 ene 1984 año
9.519
+0.05
0.53%
1 ene 1985 año
9.568
+0.049
0.51%
1 ene 1986 año
11.087
+1.519
15.88%
1 ene 1987 año
9.326
-1.761
-15.89%
1 ene 1988 año
8.071
-1.255
-13.45%
1 ene 1989 año
10.04
+1.969
24.39%
1 ene 1990 año
10.403
+0.363
3.62%
1 ene 1991 año
10.549
+0.146
1.4%
1 ene 1992 año
8.836
-1.713
-16.24%
1 ene 1993 año
9.161
+0.325
3.68%
1 ene 1994 año
9.77
+0.609
6.65%
1 ene 1995 año
11.009
+1.239
12.68%
1 ene 1996 año
11.872
+0.862
7.83%
1 ene 1997 año
11.221
-0.65
-5.48%
1 ene 1998 año
11.101
-0.12
-1.07%
1 ene 1999 año
10.499
-0.602
-5.42%
1 ene 2000 año
8.268
-2.231
-21.25%
1 ene 2001 año
9.0
+0.732
8.86%
1 ene 2002 año
9.245
+0.245
2.72%
1 ene 2003 año
9.803
+0.558
6.03%
1 ene 2004 año
10.705
+0.902
9.21%
1 ene 2005 año
11.828
+1.123
10.49%
1 ene 2006 año
12.116
+0.287
2.43%
1 ene 2007 año
12.822
+0.707
5.83%
1 ene 2008 año
14.966
+2.143
16.72%
1 ene 2009 año
15.563
+0.597
3.99%
1 ene 2010 año
18.208
+2.645
16.99%
1 ene 2011 año
19.642
+1.434
7.88%
1 ene 2012 año
20.37
+0.727
3.7%
1 ene 2013 año
21.011
+0.641
3.15%
1 ene 2014 año
21.922
+0.912
4.34%
1 ene 2015 año
20.935
-0.987
-4.5%
Ranking de los países por los datos estadísticos actuales


Comentarios: