29
/es/
es
AIzaSyAYiBZKx7MnpbEhh9jyipgxe19OcubqV5w
April 1, 2024
62515
World
WLD
false
2
1
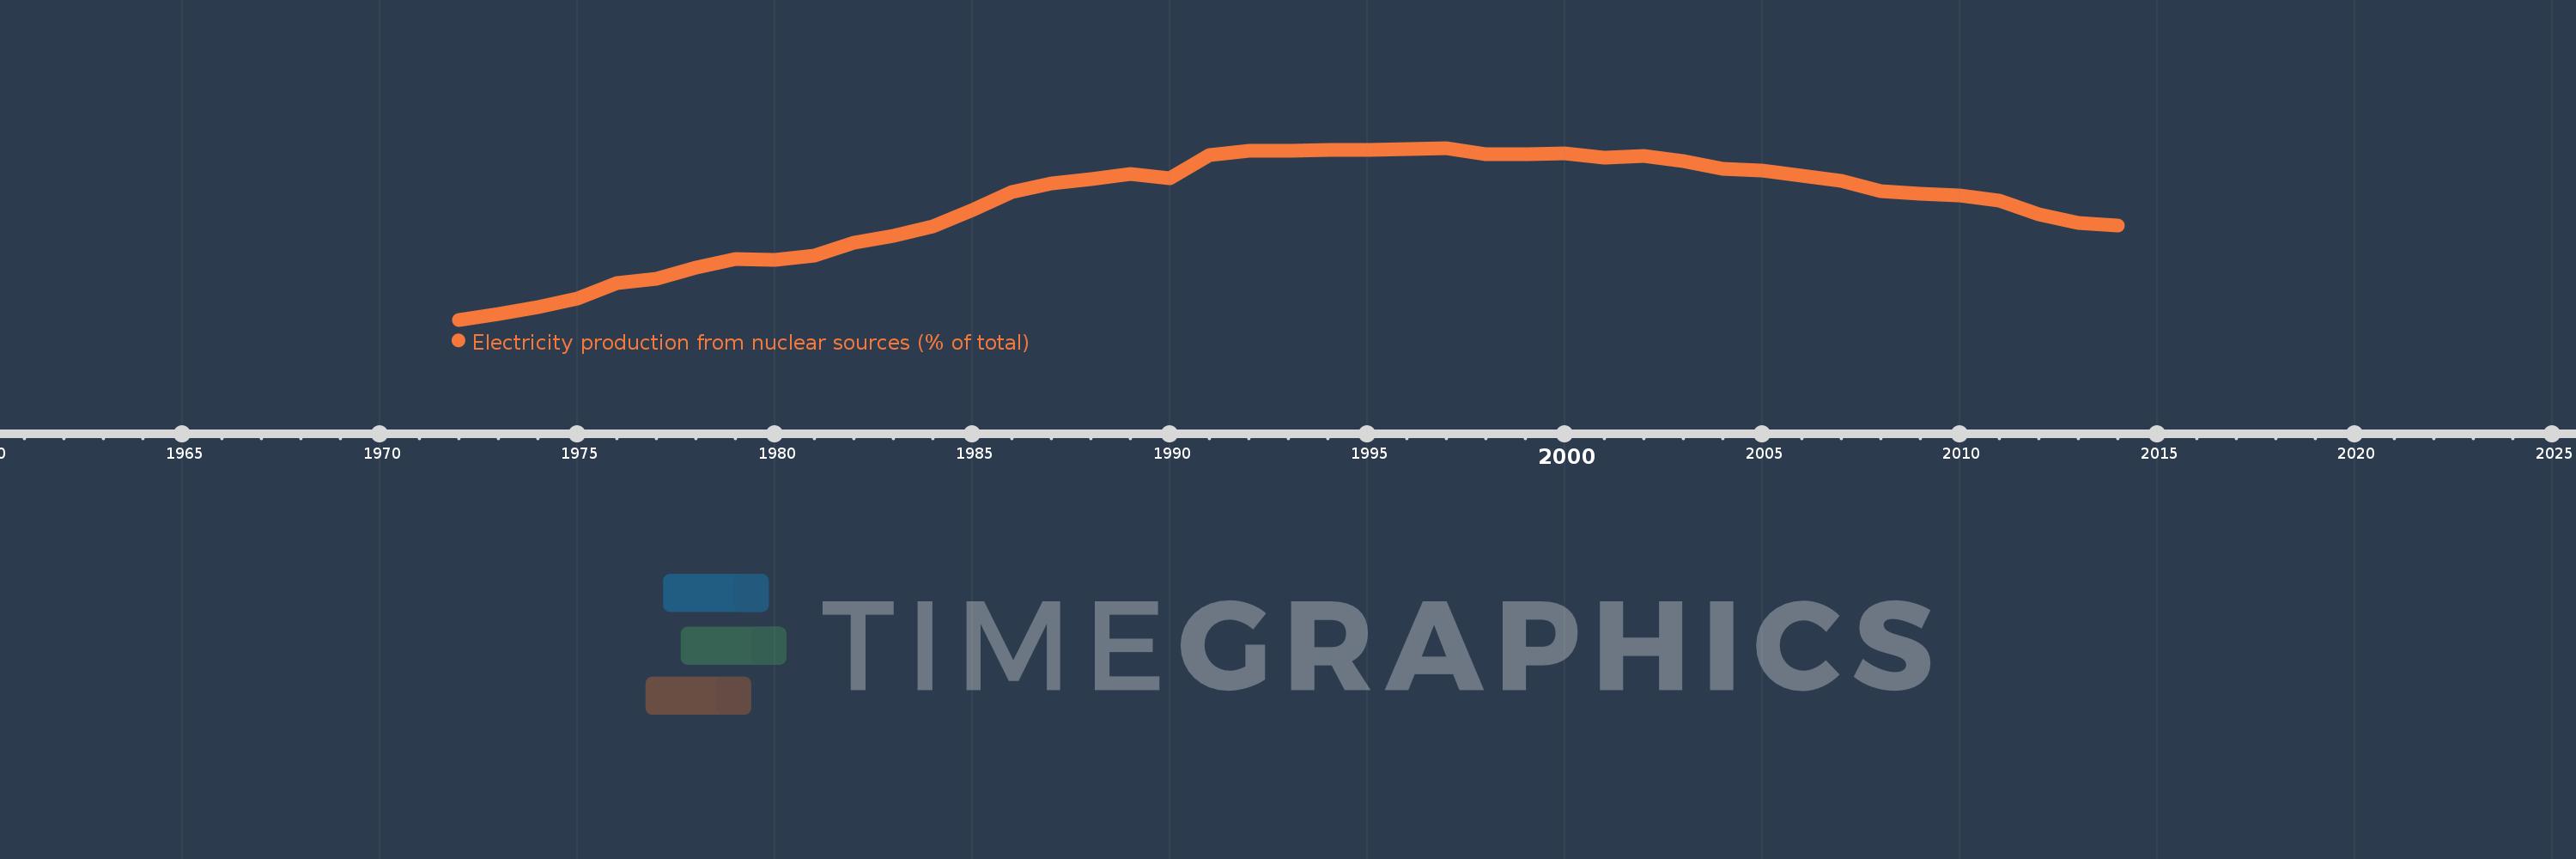
Electricity production from nuclear sources (% of total)
2014,2013,2012,2011,2010,2009,2008,2007,2006,2005,2004,2003,2002,2001,2000,1999,1998,1997,1996,1995,1994,1993,1992,1991,1990,1989,1988,1987,1986,1985,1984,1983,1982,1981,1980,1979,1978,1977,1976,1975,1974,1973,1972
Estas estadísticas en otros países:
AlbaniaAlgeriaAngolaArab WorldArgentinaArmeniaAustraliaAustriaAzerbaijanBahrainBangladeshBelarusBelgiumBeninBoliviaBosnia and HerzegovinaBotswanaBrazilBrunei DarussalamBulgariaCambodiaCameroonCanadaCentral Europe and the BalticsChileChinaColombiaCongo, Dem. Rep.Congo, Rep.Costa RicaCote d'IvoireCroatiaCubaCuracaoCyprusCzech RepublicDenmarkDominican RepublicEarly-demographic dividendEast Asia & PacificEast Asia & Pacific (excluding high income)East Asia & Pacific (IDA & IBRD countries)EcuadorEgypt, Arab Rep.El SalvadorEritreaEstoniaEthiopiaEuro areaEurope & Central AsiaEurope & Central Asia (excluding high income)Europe & Central Asia (IDA & IBRD countries)European UnionFinlandFragile and conflict affected situationsFranceGabonGeorgiaGermanyGhanaGibraltarGreeceGuatemalaHaitiHeavily indebted poor countries (HIPC)High incomeHondurasHong Kong SAR, ChinaHungaryIBRD onlyIcelandIDA & IBRD totalIDA blendIDA onlyIDA totalIndiaIndonesiaIran, Islamic Rep.IraqIrelandIsraelItalyJamaicaJapanJordanKazakhstanKenyaKorea, Dem. People’s Rep.Korea, Rep.KosovoKuwaitKyrgyz RepublicLate-demographic dividendLatin America & Caribbean Latin America & Caribbean (excluding high income)Latin America & the Caribbean (IDA & IBRD countries)LatviaLeast developed countries: UN classificationLebanonLibyaLithuaniaLow & middle incomeLower middle incomeLuxembourgMacedonia, FYRMalaysiaMaltaMauritiusMexicoMiddle East & North AfricaMiddle East & North Africa (excluding high income)Middle East & North Africa (IDA & IBRD countries)Middle incomeMoldovaMongoliaMontenegroMoroccoMozambiqueMyanmarNamibiaNepalNetherlandsNew ZealandNicaraguaNigerNigeriaNorth AmericaNorwayOECD membersOmanOther small statesPakistanPanamaParaguayPeruPhilippinesPolandPortugalPost-demographic dividendPre-demographic dividendQatarRomaniaRussian FederationSaudi ArabiaSenegalSerbiaSingaporeSlovak RepublicSloveniaSmall statesSouth AfricaSouth AsiaSouth Asia (IDA & IBRD)South SudanSpainSri LankaSub-Saharan Africa Sub-Saharan Africa (excluding high income)Sub-Saharan Africa (IDA & IBRD countries)SudanSwedenSwitzerlandSyrian Arab RepublicTajikistanTanzaniaThailandTogoTrinidad and TobagoTunisiaTurkeyTurkmenistanUkraineUnited Arab EmiratesUnited KingdomUnited StatesUpper middle incomeUruguayUzbekistanVenezuela, RBVietnamWorldYemen, Rep.ZambiaZimbabwe línea de tiempo (timeline):
En esta escala de tiempo se presenta un gráfico de 1972 y 2014 de World. Los datos de 1971 están ausentes. El número de observaciones reales por fecha: 43.
Fuente (nombre):
Indicadores del desarrollo mundial
Fuente (organización):
IEA Statistics © OECD/IEA 2014 (http://www.iea.org/stats/index.asp), subject to https://www.iea.org/t&c/termsandconditions/
Categorías:
Energy & Mining, Climate Change, Infrastructure
Se ha actualizado:
23 abr 2017 año
Los indicadores de los cambios de valor en los últimos años
Mínimo:
2.003
1 ene 1972 año
Máximo:
17.637
1 ene 1997 año
A la fecha de observación
Valor
Cambio absoluto
El cambio con respecto al valor anterior
1 ene 1972 año
2.003
+2.003
0.0%
1 ene 1973 año
2.518
+0.515
25.7%
1 ene 1974 año
3.118
+0.6
23.85%
1 ene 1975 año
3.954
+0.836
26.83%
1 ene 1976 año
5.336
+1.382
34.95%
1 ene 1977 año
5.752
+0.415
7.78%
1 ene 1978 año
6.778
+1.026
17.84%
1 ene 1979 año
7.556
+0.778
11.47%
1 ene 1980 año
7.452
-0.104
-1.38%
1 ene 1981 año
7.806
+0.354
4.76%
1 ene 1982 año
9.035
+1.229
15.74%
1 ene 1983 año
9.636
+0.601
6.66%
1 ene 1984 año
10.49
+0.854
8.86%
1 ene 1985 año
11.953
+1.463
13.94%
1 ene 1986 año
13.647
+1.694
14.17%
1 ene 1987 año
14.419
+0.771
5.65%
1 ene 1988 año
14.798
+0.379
2.63%
1 ene 1989 año
15.285
+0.487
3.29%
1 ene 1990 año
14.896
-0.389
-2.54%
1 ene 1991 año
16.974
+2.078
13.95%
1 ene 1992 año
17.362
+0.388
2.29%
1 ene 1993 año
17.351
-0.011
-0.07%
1 ene 1994 año
17.481
+0.13
0.75%
1 ene 1995 año
17.469
-0.012
-0.07%
1 ene 1996 año
17.565
+0.096
0.55%
1 ene 1997 año
17.637
+0.073
0.41%
1 ene 1998 año
17.098
-0.539
-3.06%
1 ene 1999 año
17.034
-0.064
-0.37%
1 ene 2000 año
17.149
+0.114
0.67%
1 ene 2001 año
16.762
-0.387
-2.26%
1 ene 2002 año
16.938
+0.176
1.05%
1 ene 2003 año
16.443
-0.495
-2.92%
1 ene 2004 año
15.725
-0.718
-4.36%
1 ene 2005 año
15.6
-0.125
-0.8%
1 ene 2006 año
15.114
-0.486
-3.12%
1 ene 2007 año
14.674
-0.44
-2.91%
1 ene 2008 año
13.691
-0.982
-6.69%
1 ene 2009 año
13.494
-0.197
-1.44%
1 ene 2010 año
13.349
-0.145
-1.08%
1 ene 2011 año
12.819
-0.53
-3.97%
1 ene 2012 año
11.632
-1.187
-9.26%
1 ene 2013 año
10.837
-0.795
-6.84%
1 ene 2014 año
10.611
-0.226
-2.08%
Ranking de los países por los datos estadísticos actuales


Comentarios: