29
/es/
es
AIzaSyAYiBZKx7MnpbEhh9jyipgxe19OcubqV5w
April 1, 2024
275586
United Kingdom
GBR
true
2
1
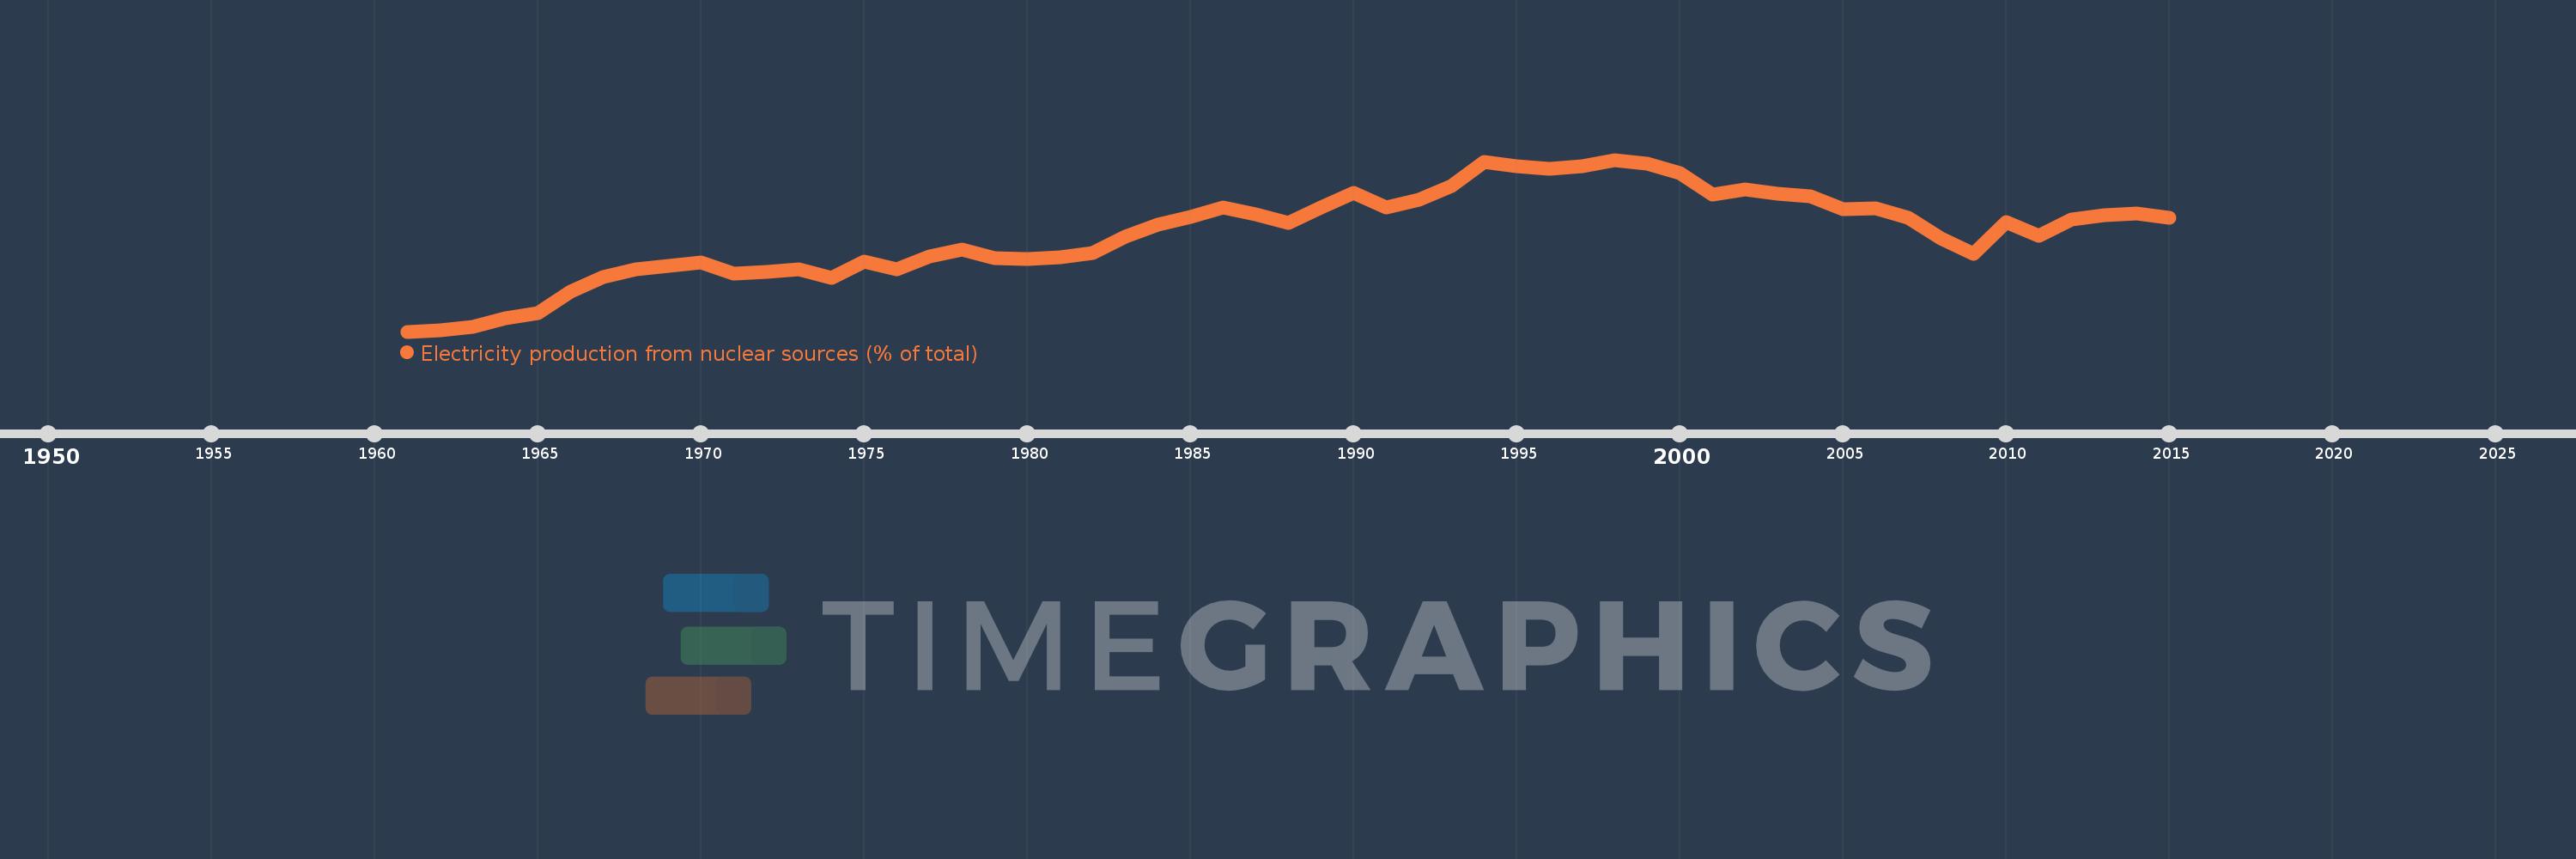
Electricity production from nuclear sources (% of total)
2015,2014,2013,2012,2011,2010,2009,2008,2007,2006,2005,2004,2003,2002,2001,2000,1999,1998,1997,1996,1995,1994,1993,1992,1991,1990,1989,1988,1987,1986,1985,1984,1983,1982,1981,1980,1979,1978,1977,1976,1975,1974,1973,1972,1971,1970,1969,1968,1967,1966,1965,1964,1963,1962,1961
Estas estadísticas en otros países:
AlbaniaAlgeriaAngolaArab WorldArgentinaArmeniaAustraliaAustriaAzerbaijanBahrainBangladeshBelarusBelgiumBeninBoliviaBosnia and HerzegovinaBotswanaBrazilBrunei DarussalamBulgariaCambodiaCameroonCanadaCentral Europe and the BalticsChileChinaColombiaCongo, Dem. Rep.Congo, Rep.Costa RicaCote d'IvoireCroatiaCubaCuracaoCyprusCzech RepublicDenmarkDominican RepublicEarly-demographic dividendEast Asia & PacificEast Asia & Pacific (excluding high income)East Asia & Pacific (IDA & IBRD countries)EcuadorEgypt, Arab Rep.El SalvadorEritreaEstoniaEthiopiaEuro areaEurope & Central AsiaEurope & Central Asia (excluding high income)Europe & Central Asia (IDA & IBRD countries)European UnionFinlandFragile and conflict affected situationsFranceGabonGeorgiaGermanyGhanaGibraltarGreeceGuatemalaHaitiHeavily indebted poor countries (HIPC)High incomeHondurasHong Kong SAR, ChinaHungaryIBRD onlyIcelandIDA & IBRD totalIDA blendIDA onlyIDA totalIndiaIndonesiaIran, Islamic Rep.IraqIrelandIsraelItalyJamaicaJapanJordanKazakhstanKenyaKorea, Dem. People’s Rep.Korea, Rep.KosovoKuwaitKyrgyz RepublicLate-demographic dividendLatin America & Caribbean Latin America & Caribbean (excluding high income)Latin America & the Caribbean (IDA & IBRD countries)LatviaLeast developed countries: UN classificationLebanonLibyaLithuaniaLow & middle incomeLower middle incomeLuxembourgMacedonia, FYRMalaysiaMaltaMauritiusMexicoMiddle East & North AfricaMiddle East & North Africa (excluding high income)Middle East & North Africa (IDA & IBRD countries)Middle incomeMoldovaMongoliaMontenegroMoroccoMozambiqueMyanmarNamibiaNepalNetherlandsNew ZealandNicaraguaNigerNigeriaNorth AmericaNorwayOECD membersOmanOther small statesPakistanPanamaParaguayPeruPhilippinesPolandPortugalPost-demographic dividendPre-demographic dividendQatarRomaniaRussian FederationSaudi ArabiaSenegalSerbiaSingaporeSlovak RepublicSloveniaSmall statesSouth AfricaSouth AsiaSouth Asia (IDA & IBRD)South SudanSpainSri LankaSub-Saharan Africa Sub-Saharan Africa (excluding high income)Sub-Saharan Africa (IDA & IBRD countries)SudanSwedenSwitzerlandSyrian Arab RepublicTajikistanTanzaniaThailandTogoTrinidad and TobagoTunisiaTurkeyTurkmenistanUkraineUnited Arab EmiratesUnited KingdomUnited StatesUpper middle incomeUruguayUzbekistanVenezuela, RBVietnamWorldYemen, Rep.ZambiaZimbabwe línea de tiempo (timeline):
En esta escala de tiempo se presenta un gráfico de 1961 y 2015 de United Kingdom. Los datos de 1960 están ausentes. El número de observaciones reales por fecha: 55.
Fuente (nombre):
Indicadores del desarrollo mundial
Fuente (organización):
IEA Statistics © OECD/IEA 2014 (http://www.iea.org/stats/index.asp), subject to https://www.iea.org/t&c/termsandconditions/
Categorías:
Energy & Mining, Climate Change, Infrastructure
Se ha actualizado:
23 abr 2017 año
Los indicadores de los cambios de valor en los últimos años
Mínimo:
1.603
1 ene 1961 año
Máximo:
28.108
1 ene 1998 año
A la fecha de observación
Valor
Cambio absoluto
El cambio con respecto al valor anterior
1 ene 1961 año
1.603
+1.603
0.0%
1 ene 1962 año
1.738
+0.135
8.41%
1 ene 1963 año
2.3
+0.562
32.34%
1 ene 1964 año
3.652
+1.352
58.81%
1 ene 1965 año
4.458
+0.806
22.08%
1 ene 1966 año
7.734
+3.275
73.47%
1 ene 1967 año
10.02
+2.287
29.57%
1 ene 1968 año
11.215
+1.195
11.92%
1 ene 1969 año
11.765
+0.549
4.9%
1 ene 1970 año
12.242
+0.478
4.06%
1 ene 1971 año
10.488
-1.754
-14.33%
1 ene 1972 año
10.771
+0.283
2.7%
1 ene 1973 año
11.18
+0.409
3.8%
1 ene 1974 año
9.951
-1.229
-11.0%
1 ene 1975 año
12.341
+2.39
24.02%
1 ene 1976 año
11.204
-1.137
-9.22%
1 ene 1977 año
13.134
+1.93
17.23%
1 ene 1978 año
14.205
+1.071
8.16%
1 ene 1979 año
12.994
-1.211
-8.53%
1 ene 1980 año
12.827
-0.167
-1.29%
1 ene 1981 año
13.033
+0.206
1.6%
1 ene 1982 año
13.722
+0.689
5.29%
1 ene 1983 año
16.185
+2.463
17.95%
1 ene 1984 año
18.118
+1.933
11.94%
1 ene 1985 año
19.251
+1.133
6.25%
1 ene 1986 año
20.73
+1.479
7.68%
1 ene 1987 año
19.735
-0.994
-4.8%
1 ene 1988 año
18.312
-1.423
-7.21%
1 ene 1989 año
20.69
+2.378
12.99%
1 ene 1990 año
22.942
+2.252
10.88%
1 ene 1991 año
20.692
-2.25
-9.81%
1 ene 1992 año
21.952
+1.26
6.09%
1 ene 1993 año
24.051
+2.099
9.56%
1 ene 1994 año
27.778
+3.727
15.5%
1 ene 1995 año
27.162
-0.617
-2.22%
1 ene 1996 año
26.757
-0.405
-1.49%
1 ene 1997 año
27.102
+0.345
1.29%
1 ene 1998 año
28.108
+1.006
3.71%
1 ene 1999 año
27.552
-0.555
-1.98%
1 ene 2000 año
26.046
-1.506
-5.47%
1 ene 2001 año
22.721
-3.325
-12.76%
1 ene 2002 año
23.562
+0.841
3.7%
1 ene 2003 año
22.842
-0.72
-3.06%
1 ene 2004 año
22.425
-0.416
-1.82%
1 ene 2005 año
20.445
-1.98
-8.83%
1 ene 2006 año
20.641
+0.195
0.96%
1 ene 2007 año
19.178
-1.463
-7.09%
1 ene 2008 año
16.039
-3.139
-16.37%
1 ene 2009 año
13.64
-2.399
-14.96%
1 ene 2010 año
18.523
+4.884
35.8%
1 ene 2011 año
16.415
-2.108
-11.38%
1 ene 2012 año
18.933
+2.518
15.34%
1 ene 2013 año
19.533
+0.6
3.17%
1 ene 2014 año
19.819
+0.287
1.47%
1 ene 2015 año
19.191
-0.629
-3.17%
Ranking de los países por los datos estadísticos actuales


Comentarios: