29
/es/
es
AIzaSyAYiBZKx7MnpbEhh9jyipgxe19OcubqV5w
April 1, 2024
61989
Upper middle income
UMC
false
2
1
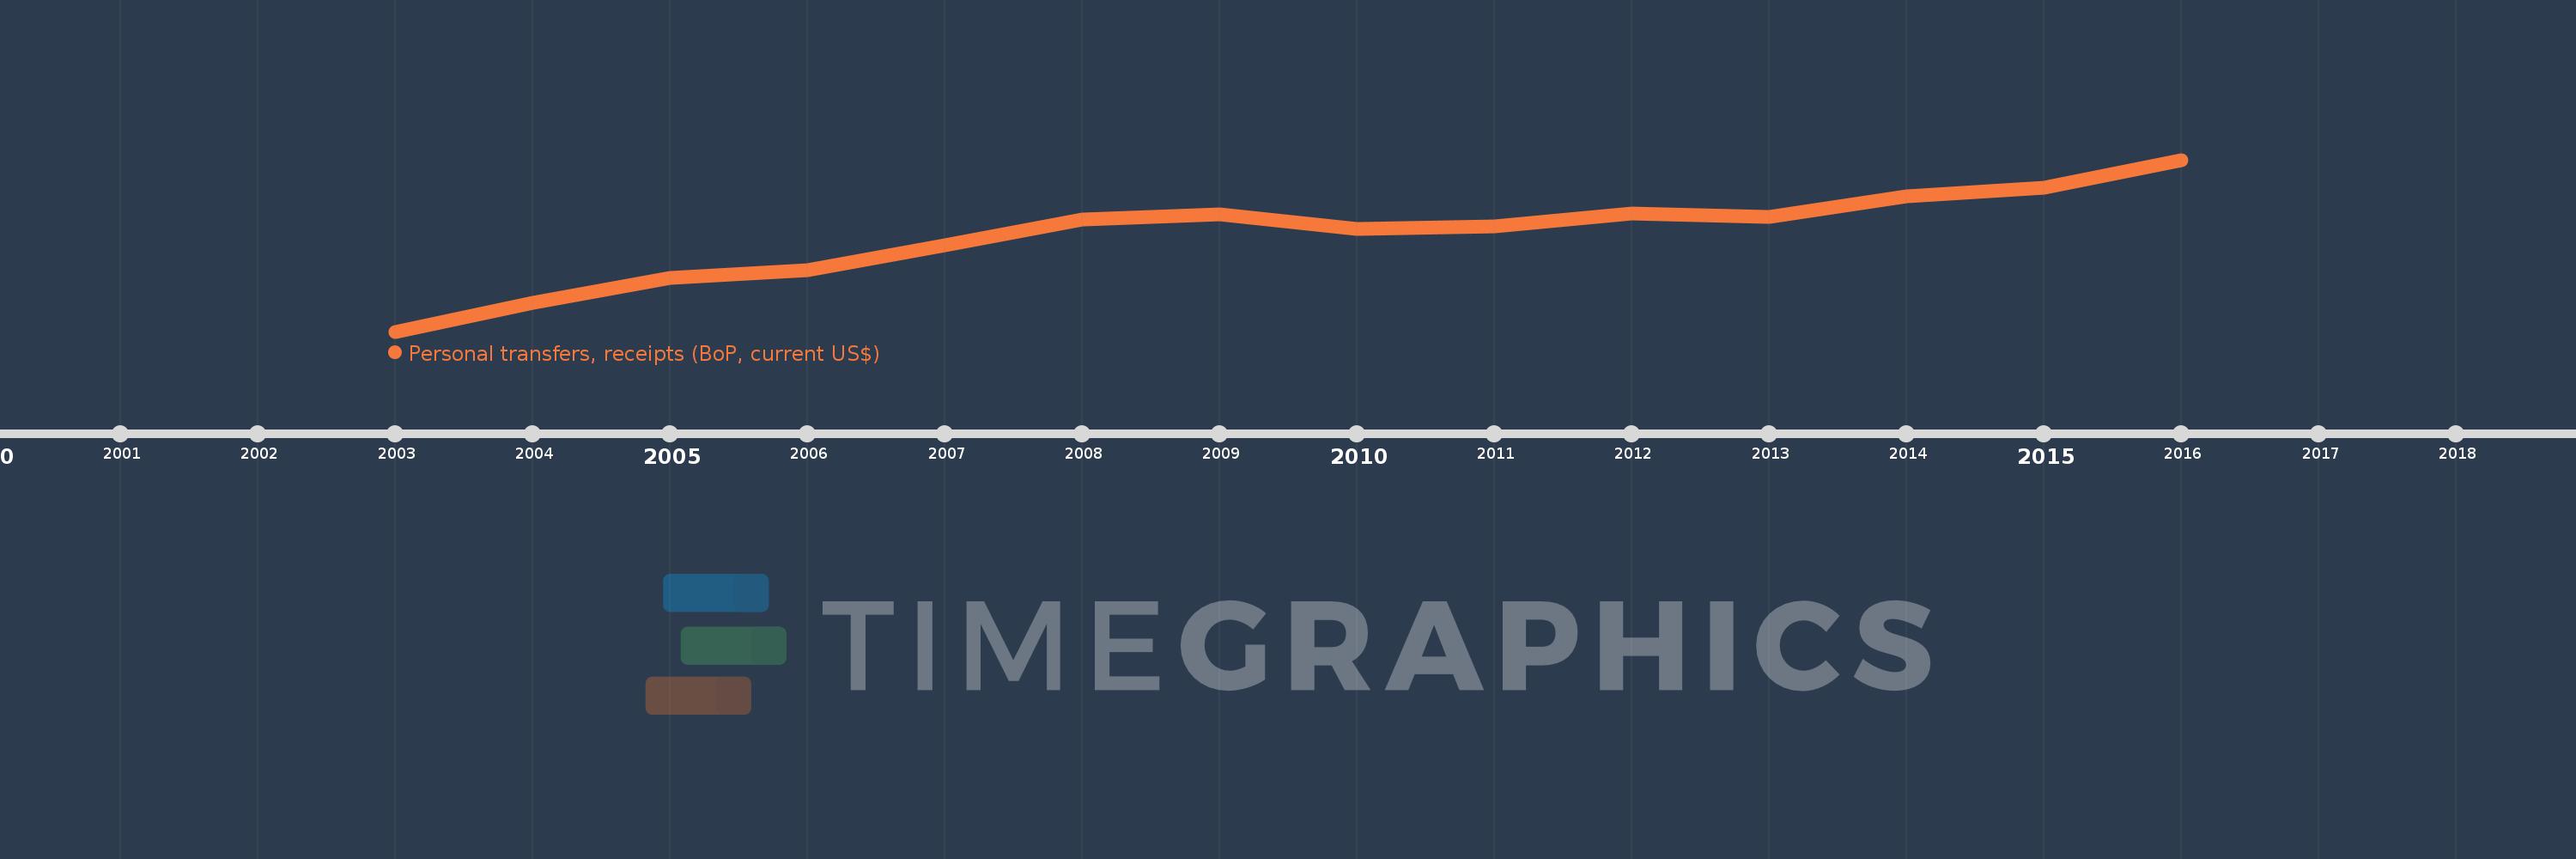
Personal transfers, receipts (BoP, current US$)
2016,2015,2014,2013,2012,2011,2010,2009,2008,2007,2006,2005,2004,2003
Estas estadísticas en otros países:
línea de tiempo (timeline):
En esta escala de tiempo se presenta un gráfico de 2003 y 2016 de Upper middle income. Los datos de 2002 están ausentes. El número de observaciones reales por fecha: 14.
Fuente (nombre):
Indicadores del desarrollo mundial
Fuente (organización):
International Monetary Fund, Balance of Payments Statistics Yearbook and data files.
Categorías:
Economy & Growth, Financial Sector
Se ha actualizado:
23 abr 2017 año
Los indicadores de los cambios de valor en los últimos años
Mínimo:
30.926 bn
1 ene 2003 año
Máximo:
89.674 bn
1 ene 2016 año
A la fecha de observación
Valor
Cambio absoluto
El cambio con respecto al valor anterior
1 ene 2003 año
30.926 bn
+30.926 bn
0.0%
1 ene 2004 año
40.682 bn
+9.756 bn
31.55%
1 ene 2005 año
49.241 bn
+8.559 bn
21.04%
1 ene 2006 año
52.027 bn
+2.786 bn
5.66%
1 ene 2007 año
60.45 bn
+8.423 bn
16.19%
1 ene 2008 año
69.391 bn
+8.941 bn
14.79%
1 ene 2009 año
71.014 bn
+1.623 bn
2.34%
1 ene 2010 año
66.001 bn
-5.013 bn
-7.06%
1 ene 2011 año
67.033 bn
+1.033 bn
1.56%
1 ene 2012 año
71.413 bn
+4.379 bn
6.53%
1 ene 2013 año
70.065 bn
-1.348 bn
-1.89%
1 ene 2014 año
77.278 bn
+7.213 bn
10.3%
1 ene 2015 año
80.117 bn
+2.839 bn
3.67%
1 ene 2016 año
89.674 bn
+9.558 bn
11.93%
Ranking de los países por los datos estadísticos actuales


Comentarios: