29
/es/
es
AIzaSyAYiBZKx7MnpbEhh9jyipgxe19OcubqV5w
April 1, 2024
47518
Lower middle income
LMC
false
2
1
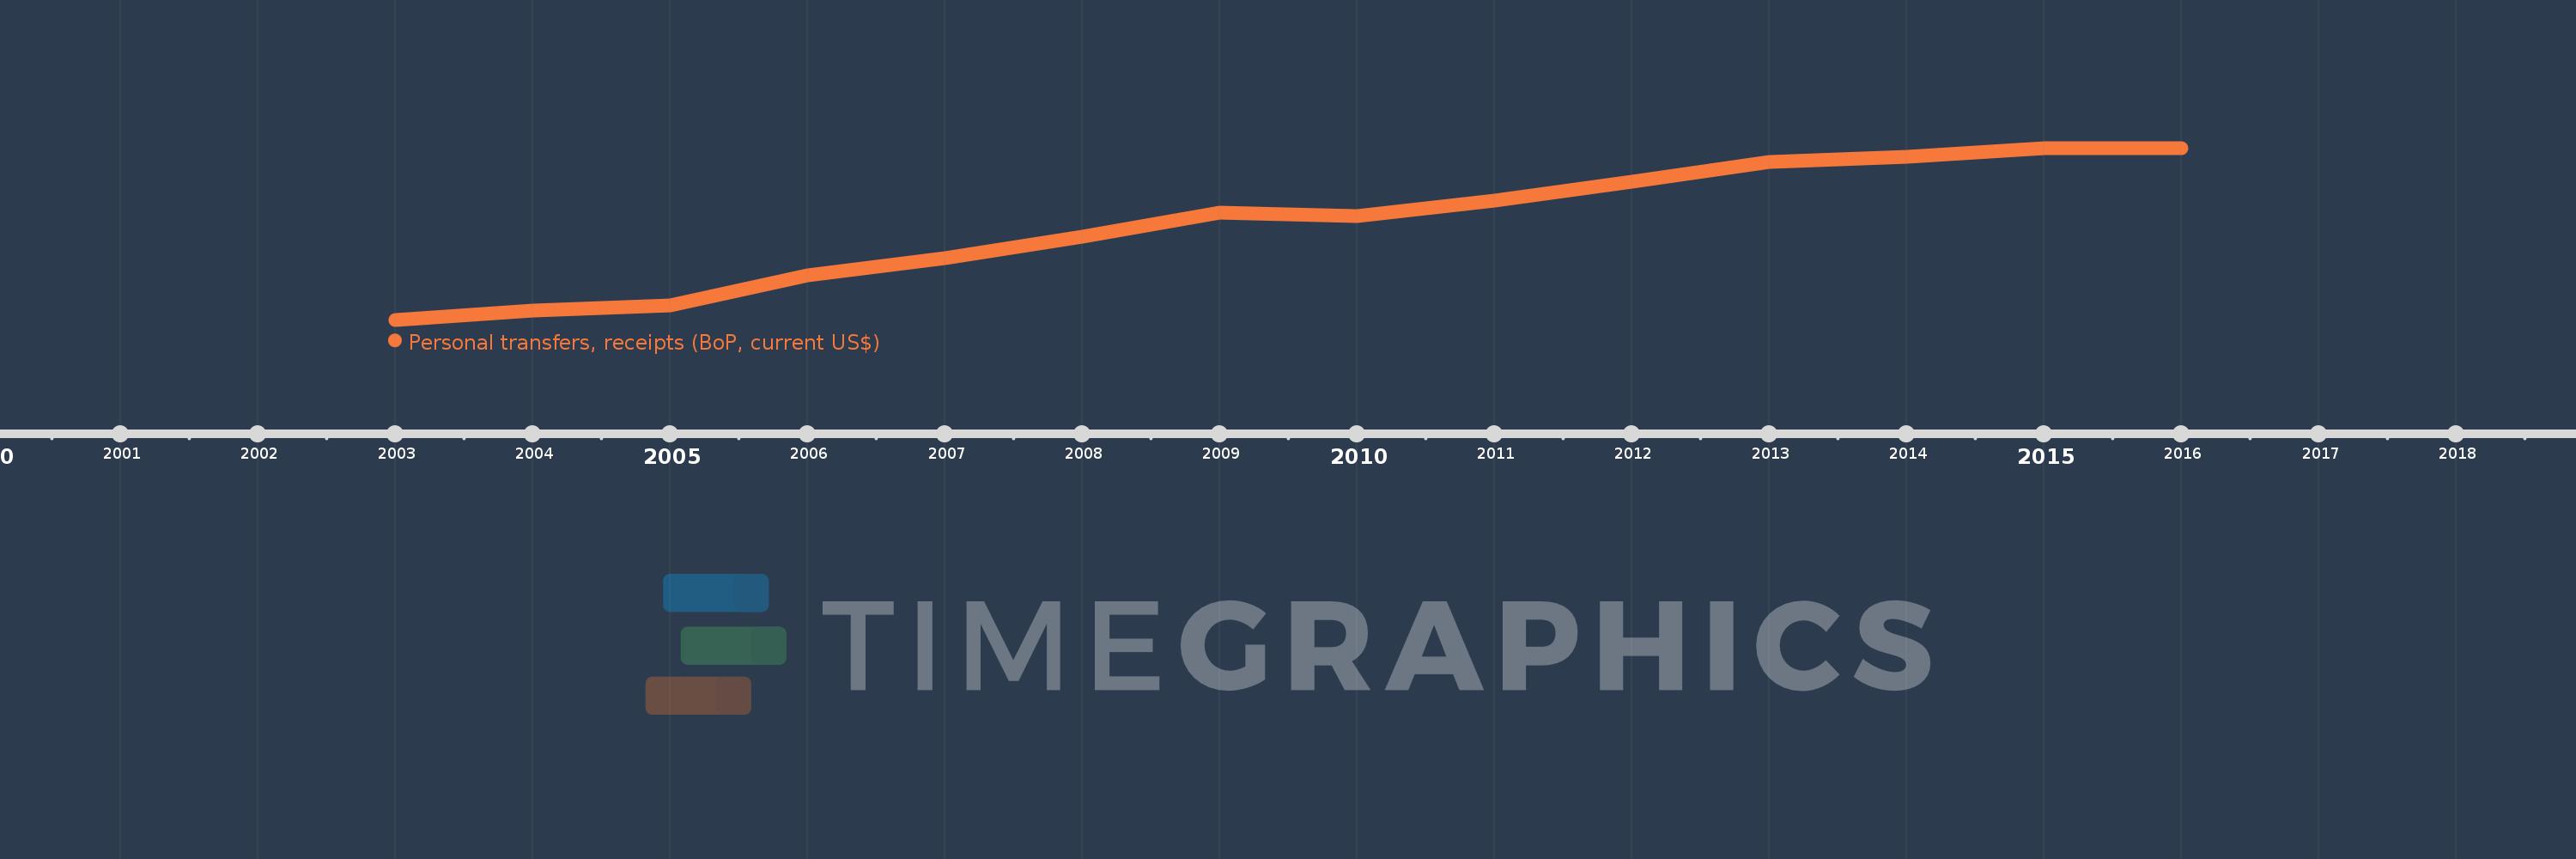
Personal transfers, receipts (BoP, current US$)
2016,2015,2014,2013,2012,2011,2010,2009,2008,2007,2006,2005,2004,2003
Estas estadísticas en otros países:
línea de tiempo (timeline):
En esta escala de tiempo se presenta un gráfico de 2003 y 2016 de Lower middle income. Los datos de 2002 están ausentes. El número de observaciones reales por fecha: 14.
Fuente (nombre):
Indicadores del desarrollo mundial
Fuente (organización):
International Monetary Fund, Balance of Payments Statistics Yearbook and data files.
Categorías:
Economy & Growth, Financial Sector
Se ha actualizado:
23 abr 2017 año
Los indicadores de los cambios de valor en los últimos años
Mínimo:
47.059 bn
1 ene 2003 año
Máximo:
218.864 bn
1 ene 2016 año
A la fecha de observación
Valor
Cambio absoluto
El cambio con respecto al valor anterior
1 ene 2003 año
47.059 bn
+47.059 bn
0.0%
1 ene 2004 año
56.464 bn
+9.406 bn
19.99%
1 ene 2005 año
61.11 bn
+4.646 bn
8.23%
1 ene 2006 año
91.349 bn
+30.239 bn
49.48%
1 ene 2007 año
108.934 bn
+17.585 bn
19.25%
1 ene 2008 año
130.097 bn
+21.163 bn
19.43%
1 ene 2009 año
154.564 bn
+24.467 bn
18.81%
1 ene 2010 año
151.071 bn
-3.493 bn
-2.26%
1 ene 2011 año
165.855 bn
+14.784 bn
9.79%
1 ene 2012 año
185.204 bn
+19.349 bn
11.67%
1 ene 2013 año
205.184 bn
+19.98 bn
10.79%
1 ene 2014 año
209.747 bn
+4.564 bn
2.22%
1 ene 2015 año
218.68 bn
+8.933 bn
4.26%
1 ene 2016 año
218.864 bn
+184.008 millones
0.08%
Ranking de los países por los datos estadísticos actuales


Comentarios: