29
/es/
es
AIzaSyAYiBZKx7MnpbEhh9jyipgxe19OcubqV5w
April 1, 2024
61926
Upper middle income
UMC
false
2
1
Net official development assistance and official aid received (current US$)
2016,2015,2014,2013,2012,2011,2010,2009,2008,2007,2006,2005,2004,2003,2002,2001,2000,1999,1998,1997,1996,1995,1994,1993,1992,1991,1990,1989,1988,1987,1986,1985,1984,1983,1982,1981,1980,1979,1978,1977,1976,1975,1974,1973,1972,1971,1970,1969,1968,1967,1966,1965,1964,1963,1962,1961
Estas estadísticas en otros países:
AfghanistanAlbaniaAlgeriaAngolaAntigua and BarbudaArab WorldArgentinaArmeniaArubaAzerbaijanBahamas, TheBahrainBangladeshBarbadosBelarusBelizeBeninBermudaBhutanBoliviaBosnia and HerzegovinaBotswanaBrazilBritish Virgin IslandsBrunei DarussalamBulgariaBurkina FasoBurundiCabo VerdeCambodiaCameroonCaribbean small statesCayman IslandsCentral African RepublicCentral Europe and the BalticsChadChileChinaColombiaComorosCongo, Dem. Rep.Congo, Rep.Costa RicaCote d'IvoireCroatiaCubaCyprusCzech RepublicDjiboutiDominicaDominican RepublicEast Asia & PacificEast Asia & Pacific (excluding high income)East Asia & Pacific (IDA & IBRD countries)EcuadorEgypt, Arab Rep.El SalvadorEquatorial GuineaEritreaEstoniaEthiopiaEuro areaEurope & Central AsiaEurope & Central Asia (excluding high income)Europe & Central Asia (IDA & IBRD countries)European UnionFijiFragile and conflict affected situationsFrench PolynesiaGabonGambia, TheGeorgiaGhanaGibraltarGrenadaGuatemalaGuineaGuinea-BissauGuyanaHaitiHeavily indebted poor countries (HIPC)High incomeHondurasHong Kong SAR, ChinaHungaryIBRD onlyIDA & IBRD totalIDA blendIDA onlyIDA totalIndiaIndonesiaIran, Islamic Rep.IraqIsraelJamaicaJordanKazakhstanKenyaKiribatiKorea, Dem. People’s Rep.Korea, Rep.KosovoKuwaitKyrgyz RepublicLao PDRLatin America & Caribbean Latin America & Caribbean (excluding high income)Latin America & the Caribbean (IDA & IBRD countries)LatviaLeast developed countries: UN classificationLebanonLesothoLiberiaLibyaLithuaniaLow & middle incomeLow incomeLower middle incomeMacao SAR, ChinaMacedonia, FYRMadagascarMalawiMalaysiaMaldivesMaliMaltaMarshall IslandsMauritaniaMauritiusMexicoMicronesia, Fed. Sts.Middle East & North AfricaMiddle East & North Africa (excluding high income)Middle East & North Africa (IDA & IBRD countries)Middle incomeMoldovaMongoliaMontenegroMoroccoMozambiqueMyanmarNamibiaNauruNepalNew CaledoniaNicaraguaNigerNigeriaNorth AmericaNorthern Mariana IslandsOECD membersOmanOther small statesPacific island small statesPakistanPalauPanamaPapua New GuineaParaguayPeruPhilippinesPolandQatarRomaniaRussian FederationRwandaSamoaSao Tome and PrincipeSaudi ArabiaSenegalSerbiaSeychellesSierra LeoneSingaporeSlovak RepublicSloveniaSmall statesSolomon IslandsSomaliaSouth AfricaSouth AsiaSouth Asia (IDA & IBRD)South SudanSri LankaSt. Kitts and NevisSt. LuciaSt. Vincent and the GrenadinesSub-Saharan Africa Sub-Saharan Africa (excluding high income)Sub-Saharan Africa (IDA & IBRD countries)SudanSurinameSwazilandSyrian Arab RepublicTajikistanTanzaniaThailandTimor-LesteTogoTongaTrinidad and TobagoTunisiaTurkeyTurkmenistanTurks and Caicos IslandsTuvaluUgandaUkraineUnited Arab EmiratesUpper middle incomeUruguayUzbekistanVanuatuVenezuela, RBVietnamWest Bank and GazaWorldYemen, Rep.ZambiaZimbabwe línea de tiempo (timeline):
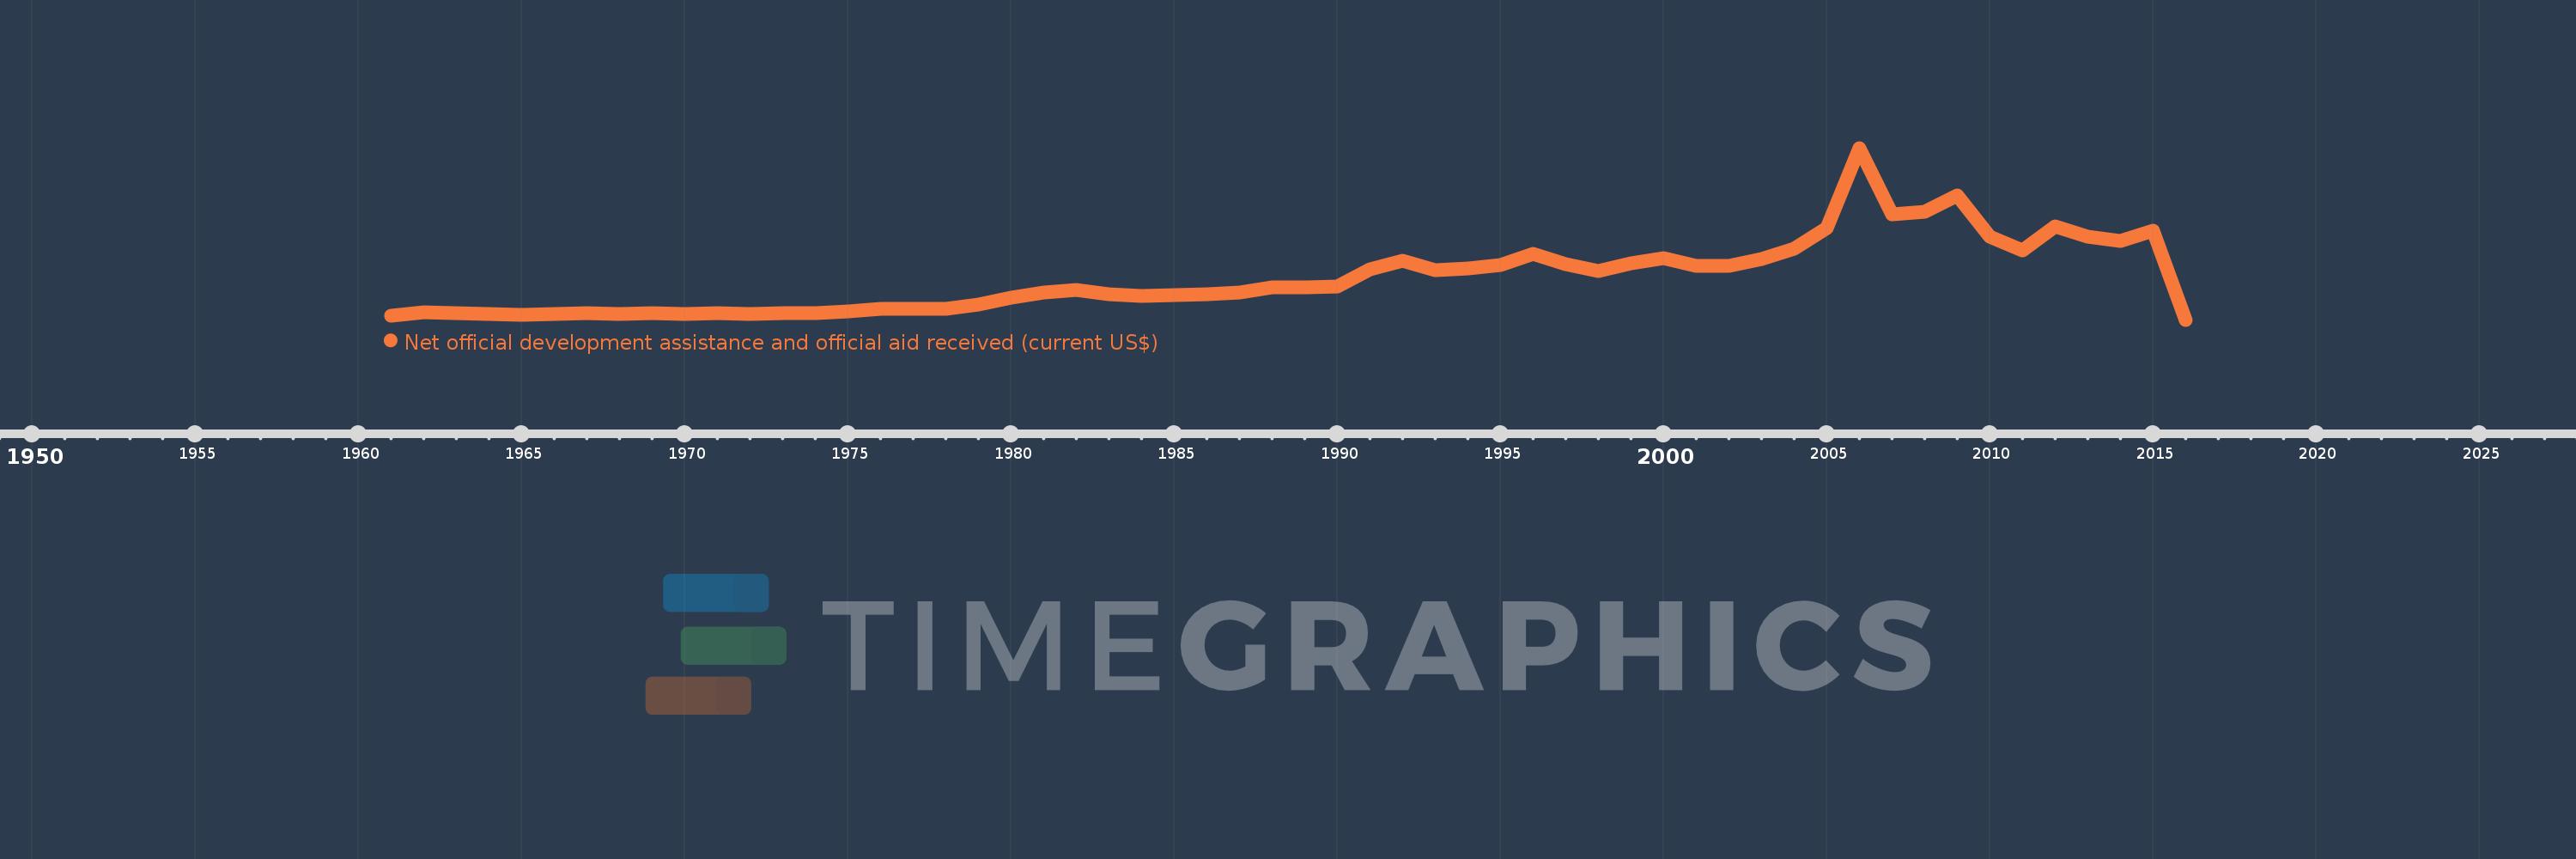
En esta escala de tiempo se presenta un gráfico de 1961 y 2016 de Upper middle income. Los datos de 1960 están ausentes. El número de observaciones reales por fecha: 56.
Fuente (nombre):
Indicadores del desarrollo mundial
Fuente (organización):
Development Assistance Committee of the Organisation for Economic Co-operation and Development, Geographical Distribution of Financial Flows to Developing Countries, Development Co-operation Report, and International Development Statistics database. Data are available online at: www.oecd.org/dac/stats/idsonline.
Categorías:
Aid Effectiveness
Se ha actualizado:
23 abr 2017 año
Los indicadores de los cambios de valor en los últimos años
Máximo:
32.336 bn
1 ene 2006 año
A la fecha de observación
Valor
Cambio absoluto
El cambio con respecto al valor anterior
1 ene 1961 año
768.77 millones
+768.77 millones
0.0%
1 ene 1962 año
1.401 bn
+631.77 millones
82.18%
1 ene 1963 año
1.225 bn
-175.55 millones
-12.53%
1 ene 1964 año
1.149 bn
-76.29 millones
-6.23%
1 ene 1965 año
996.81 millones
-151.89 millones
-13.22%
1 ene 1966 año
1.112 bn
+115.6 millones
11.6%
1 ene 1967 año
1.217 bn
+104.72 millones
9.41%
1 ene 1968 año
1.143 bn
-73.67 millones
-6.05%
1 ene 1969 año
1.281 bn
+137.29 millones
12.01%
1 ene 1970 año
1.101 bn
-179.89 millones
-14.05%
1 ene 1971 año
1.234 bn
+132.92 millones
12.07%
1 ene 1972 año
1.159 bn
-74.65 millones
-6.05%
1 ene 1973 año
1.263 bn
+103.86 millones
8.96%
1 ene 1974 año
1.275 bn
+12.45 millones
0.99%
1 ene 1975 año
1.578 bn
+302.77 millones
23.74%
1 ene 1976 año
1.99 bn
+412.12 millones
26.11%
1 ene 1977 año
2.054 bn
+63.65 millones
3.2%
1 ene 1978 año
1.993 bn
-61.3 millones
-2.98%
1 ene 1979 año
2.827 bn
+834.48 millones
41.88%
1 ene 1980 año
4.152 bn
+1.325 bn
46.87%
1 ene 1981 año
5.096 bn
+943.84 millones
22.73%
1 ene 1982 año
5.555 bn
+458.69 millones
9.0%
1 ene 1983 año
4.77 bn
-784.38 millones
-14.12%
1 ene 1984 año
4.503 bn
-267.2 millones
-5.6%
1 ene 1985 año
4.689 bn
+185.96 millones
4.13%
1 ene 1986 año
4.746 bn
+57.18 millones
1.22%
1 ene 1987 año
5.142 bn
+396.13 millones
8.35%
1 ene 1988 año
6.127 bn
+984.5 millones
19.14%
1 ene 1989 año
6.024 bn
-103.31 millones
-1.69%
1 ene 1990 año
6.276 bn
+252.07 millones
4.18%
1 ene 1991 año
9.424 bn
+3.148 bn
50.16%
1 ene 1992 año
11.067 bn
+1.644 bn
17.44%
1 ene 1993 año
9.289 bn
-1.778 bn
-16.07%
1 ene 1994 año
9.68 bn
+390.9 millones
4.21%
1 ene 1995 año
10.279 bn
+599.07 millones
6.19%
1 ene 1996 año
12.409 bn
+2.13 bn
20.72%
1 ene 1997 año
10.431 bn
-1.978 bn
-15.94%
1 ene 1998 año
9.241 bn
-1.19 bn
-11.41%
1 ene 1999 año
10.572 bn
+1.331 bn
14.4%
1 ene 2000 año
11.594 bn
+1.023 bn
9.67%
1 ene 2001 año
10.197 bn
-1.397 bn
-12.05%
1 ene 2002 año
10.143 bn
-53.28 millones
-0.52%
1 ene 2003 año
11.491 bn
+1.347 bn
13.28%
1 ene 2004 año
13.326 bn
+1.835 bn
15.97%
1 ene 2005 año
17.299 bn
+3.973 bn
29.81%
1 ene 2006 año
32.336 bn
+15.037 bn
86.93%
1 ene 2007 año
19.876 bn
-12.46 bn
-38.53%
1 ene 2008 año
20.372 bn
+495.4 millones
2.49%
1 ene 2009 año
23.372 bn
+3.0 bn
14.73%
1 ene 2010 año
15.559 bn
-7.812 bn
-33.43%
1 ene 2011 año
13.034 bn
-2.525 bn
-16.23%
1 ene 2012 año
17.655 bn
+4.621 bn
35.45%
1 ene 2013 año
15.628 bn
-2.027 bn
-11.48%
1 ene 2014 año
14.893 bn
-735.35 millones
-4.71%
1 ene 2015 año
16.722 bn
+1.83 bn
12.29%
1 ene 2016 año
0.0
-16.722 bn
-100.0%
Ranking de los países por los datos estadísticos actuales


Comentarios: