29
/es/
es
AIzaSyAYiBZKx7MnpbEhh9jyipgxe19OcubqV5w
April 1, 2024
34466
Fragile and conflict affected situations
FCS
false
2
1
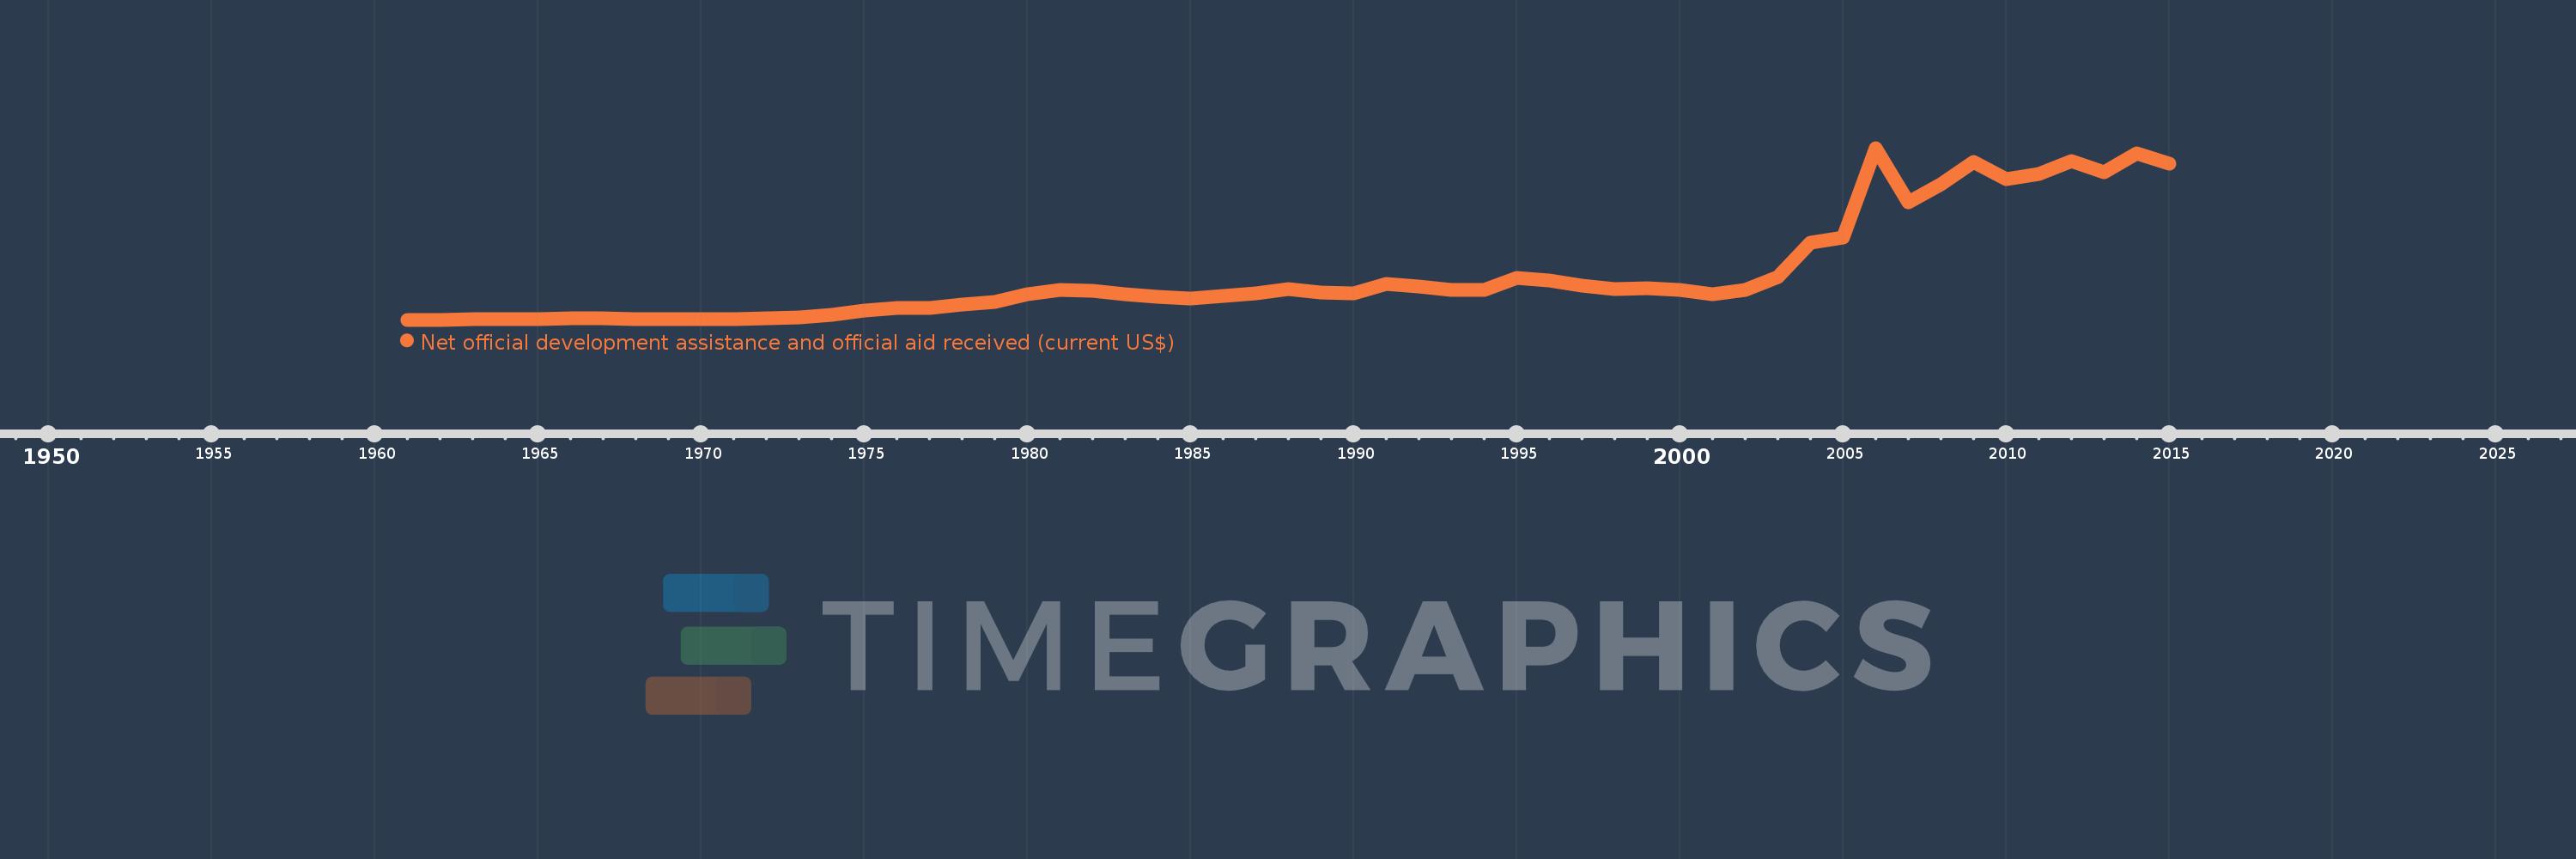
Net official development assistance and official aid received (current US$)
2015,2014,2013,2012,2011,2010,2009,2008,2007,2006,2005,2004,2003,2002,2001,2000,1999,1998,1997,1996,1995,1994,1993,1992,1991,1990,1989,1988,1987,1986,1985,1984,1983,1982,1981,1980,1979,1978,1977,1976,1975,1974,1973,1972,1971,1970,1969,1968,1967,1966,1965,1964,1963,1962,1961
Estas estadísticas en otros países:
AfghanistanAlbaniaAlgeriaAngolaAntigua and BarbudaArab WorldArgentinaArmeniaArubaAzerbaijanBahamas, TheBahrainBangladeshBarbadosBelarusBelizeBeninBermudaBhutanBoliviaBosnia and HerzegovinaBotswanaBrazilBritish Virgin IslandsBrunei DarussalamBulgariaBurkina FasoBurundiCabo VerdeCambodiaCameroonCaribbean small statesCayman IslandsCentral African RepublicCentral Europe and the BalticsChadChileChinaColombiaComorosCongo, Dem. Rep.Congo, Rep.Costa RicaCote d'IvoireCroatiaCubaCyprusCzech RepublicDjiboutiDominicaDominican RepublicEast Asia & PacificEast Asia & Pacific (excluding high income)East Asia & Pacific (IDA & IBRD countries)EcuadorEgypt, Arab Rep.El SalvadorEquatorial GuineaEritreaEstoniaEthiopiaEuro areaEurope & Central AsiaEurope & Central Asia (excluding high income)Europe & Central Asia (IDA & IBRD countries)European UnionFijiFragile and conflict affected situationsFrench PolynesiaGabonGambia, TheGeorgiaGhanaGibraltarGrenadaGuatemalaGuineaGuinea-BissauGuyanaHaitiHeavily indebted poor countries (HIPC)High incomeHondurasHong Kong SAR, ChinaHungaryIBRD onlyIDA & IBRD totalIDA blendIDA onlyIDA totalIndiaIndonesiaIran, Islamic Rep.IraqIsraelJamaicaJordanKazakhstanKenyaKiribatiKorea, Dem. People’s Rep.Korea, Rep.KosovoKuwaitKyrgyz RepublicLao PDRLatin America & Caribbean Latin America & Caribbean (excluding high income)Latin America & the Caribbean (IDA & IBRD countries)LatviaLeast developed countries: UN classificationLebanonLesothoLiberiaLibyaLithuaniaLow & middle incomeLow incomeLower middle incomeMacao SAR, ChinaMacedonia, FYRMadagascarMalawiMalaysiaMaldivesMaliMaltaMarshall IslandsMauritaniaMauritiusMexicoMicronesia, Fed. Sts.Middle East & North AfricaMiddle East & North Africa (excluding high income)Middle East & North Africa (IDA & IBRD countries)Middle incomeMoldovaMongoliaMontenegroMoroccoMozambiqueMyanmarNamibiaNauruNepalNew CaledoniaNicaraguaNigerNigeriaNorth AmericaNorthern Mariana IslandsOECD membersOmanOther small statesPacific island small statesPakistanPalauPanamaPapua New GuineaParaguayPeruPhilippinesPolandQatarRomaniaRussian FederationRwandaSamoaSao Tome and PrincipeSaudi ArabiaSenegalSerbiaSeychellesSierra LeoneSingaporeSlovak RepublicSloveniaSmall statesSolomon IslandsSomaliaSouth AfricaSouth AsiaSouth Asia (IDA & IBRD)South SudanSri LankaSt. Kitts and NevisSt. LuciaSt. Vincent and the GrenadinesSub-Saharan Africa Sub-Saharan Africa (excluding high income)Sub-Saharan Africa (IDA & IBRD countries)SudanSurinameSwazilandSyrian Arab RepublicTajikistanTanzaniaThailandTimor-LesteTogoTongaTrinidad and TobagoTunisiaTurkeyTurkmenistanTurks and Caicos IslandsTuvaluUgandaUkraineUnited Arab EmiratesUpper middle incomeUruguayUzbekistanVanuatuVenezuela, RBVietnamWest Bank and GazaWorldYemen, Rep.ZambiaZimbabwe línea de tiempo (timeline):
En esta escala de tiempo se presenta un gráfico de 1961 y 2015 de Fragile and conflict affected situations. Los datos de 1960 están ausentes. El número de observaciones reales por fecha: 55.
Fuente (nombre):
Indicadores del desarrollo mundial
Fuente (organización):
Development Assistance Committee of the Organisation for Economic Co-operation and Development, Geographical Distribution of Financial Flows to Developing Countries, Development Co-operation Report, and International Development Statistics database. Data are available online at: www.oecd.org/dac/stats/idsonline.
Categorías:
Aid Effectiveness
Se ha actualizado:
23 abr 2017 año
Los indicadores de los cambios de valor en los últimos años
Mínimo:
314.13 millones
1 ene 1961 año
Máximo:
36.261 bn
1 ene 2006 año
A la fecha de observación
Valor
Cambio absoluto
El cambio con respecto al valor anterior
1 ene 1961 año
314.13 millones
+314.13 millones
0.0%
1 ene 1962 año
348.32 millones
+34.19 millones
10.88%
1 ene 1963 año
429.11 millones
+80.79 millones
23.19%
1 ene 1964 año
410.54 millones
-18.57 millones
-4.33%
1 ene 1965 año
499.07 millones
+88.53 millones
21.56%
1 ene 1966 año
567.66 millones
+68.59 millones
13.74%
1 ene 1967 año
557.08 millones
-10.58 millones
-1.86%
1 ene 1968 año
439.95 millones
-117.13 millones
-21.03%
1 ene 1969 año
474.03 millones
+34.08 millones
7.75%
1 ene 1970 año
462.24 millones
-11.79 millones
-2.49%
1 ene 1971 año
487.85 millones
+25.61 millones
5.54%
1 ene 1972 año
578.05 millones
+90.2 millones
18.49%
1 ene 1973 año
772.17 millones
+194.12 millones
33.58%
1 ene 1974 año
1.265 bn
+493.22 millones
63.87%
1 ene 1975 año
2.247 bn
+981.41 millones
77.56%
1 ene 1976 año
2.763 bn
+516.22 millones
22.98%
1 ene 1977 año
2.688 bn
-75.2 millones
-2.72%
1 ene 1978 año
3.454 bn
+766.51 millones
28.52%
1 ene 1979 año
3.997 bn
+542.73 millones
15.71%
1 ene 1980 año
5.667 bn
+1.67 bn
41.78%
1 ene 1981 año
6.471 bn
+804.08 millones
14.19%
1 ene 1982 año
6.367 bn
-104.15 millones
-1.61%
1 ene 1983 año
5.636 bn
-731.18 millones
-11.48%
1 ene 1984 año
5.085 bn
-550.24 millones
-9.76%
1 ene 1985 año
4.71 bn
-375.73 millones
-7.39%
1 ene 1986 año
5.228 bn
+517.98 millones
11.0%
1 ene 1987 año
5.815 bn
+587.24 millones
11.23%
1 ene 1988 año
6.672 bn
+856.79 millones
14.73%
1 ene 1989 año
6.004 bn
-667.74 millones
-10.01%
1 ene 1990 año
5.832 bn
-171.83 millones
-2.86%
1 ene 1991 año
7.893 bn
+2.06 bn
35.33%
1 ene 1992 año
7.322 bn
-570.48 millones
-7.23%
1 ene 1993 año
6.497 bn
-825.02 millones
-11.27%
1 ene 1994 año
6.59 bn
+92.6 millones
1.43%
1 ene 1995 año
9.155 bn
+2.565 bn
38.93%
1 ene 1996 año
8.538 bn
-617.01 millones
-6.74%
1 ene 1997 año
7.436 bn
-1.102 bn
-12.91%
1 ene 1998 año
6.775 bn
-661.35 millones
-8.89%
1 ene 1999 año
6.865 bn
+90.47 millones
1.34%
1 ene 2000 año
6.484 bn
-381.43 millones
-5.56%
1 ene 2001 año
5.72 bn
-763.58 millones
-11.78%
1 ene 2002 año
6.586 bn
+865.94 millones
15.14%
1 ene 2003 año
9.196 bn
+2.61 bn
39.63%
1 ene 2004 año
16.484 bn
+7.289 bn
79.26%
1 ene 2005 año
17.534 bn
+1.049 bn
6.36%
1 ene 2006 año
36.261 bn
+18.727 bn
106.81%
1 ene 2007 año
24.965 bn
-11.296 bn
-31.15%
1 ene 2008 año
28.682 bn
+3.717 bn
14.89%
1 ene 2009 año
33.283 bn
+4.601 bn
16.04%
1 ene 2010 año
29.786 bn
-3.497 bn
-10.51%
1 ene 2011 año
30.873 bn
+1.087 bn
3.65%
1 ene 2012 año
33.496 bn
+2.623 bn
8.5%
1 ene 2013 año
31.251 bn
-2.245 bn
-6.7%
1 ene 2014 año
35.216 bn
+3.965 bn
12.69%
1 ene 2015 año
33.048 bn
-2.169 bn
-6.16%
Ranking de los países por los datos estadísticos actuales


Comentarios: