29
/es/
es
AIzaSyAYiBZKx7MnpbEhh9jyipgxe19OcubqV5w
April 1, 2024
58909
Sub-Saharan Africa
SSF
false
2
1
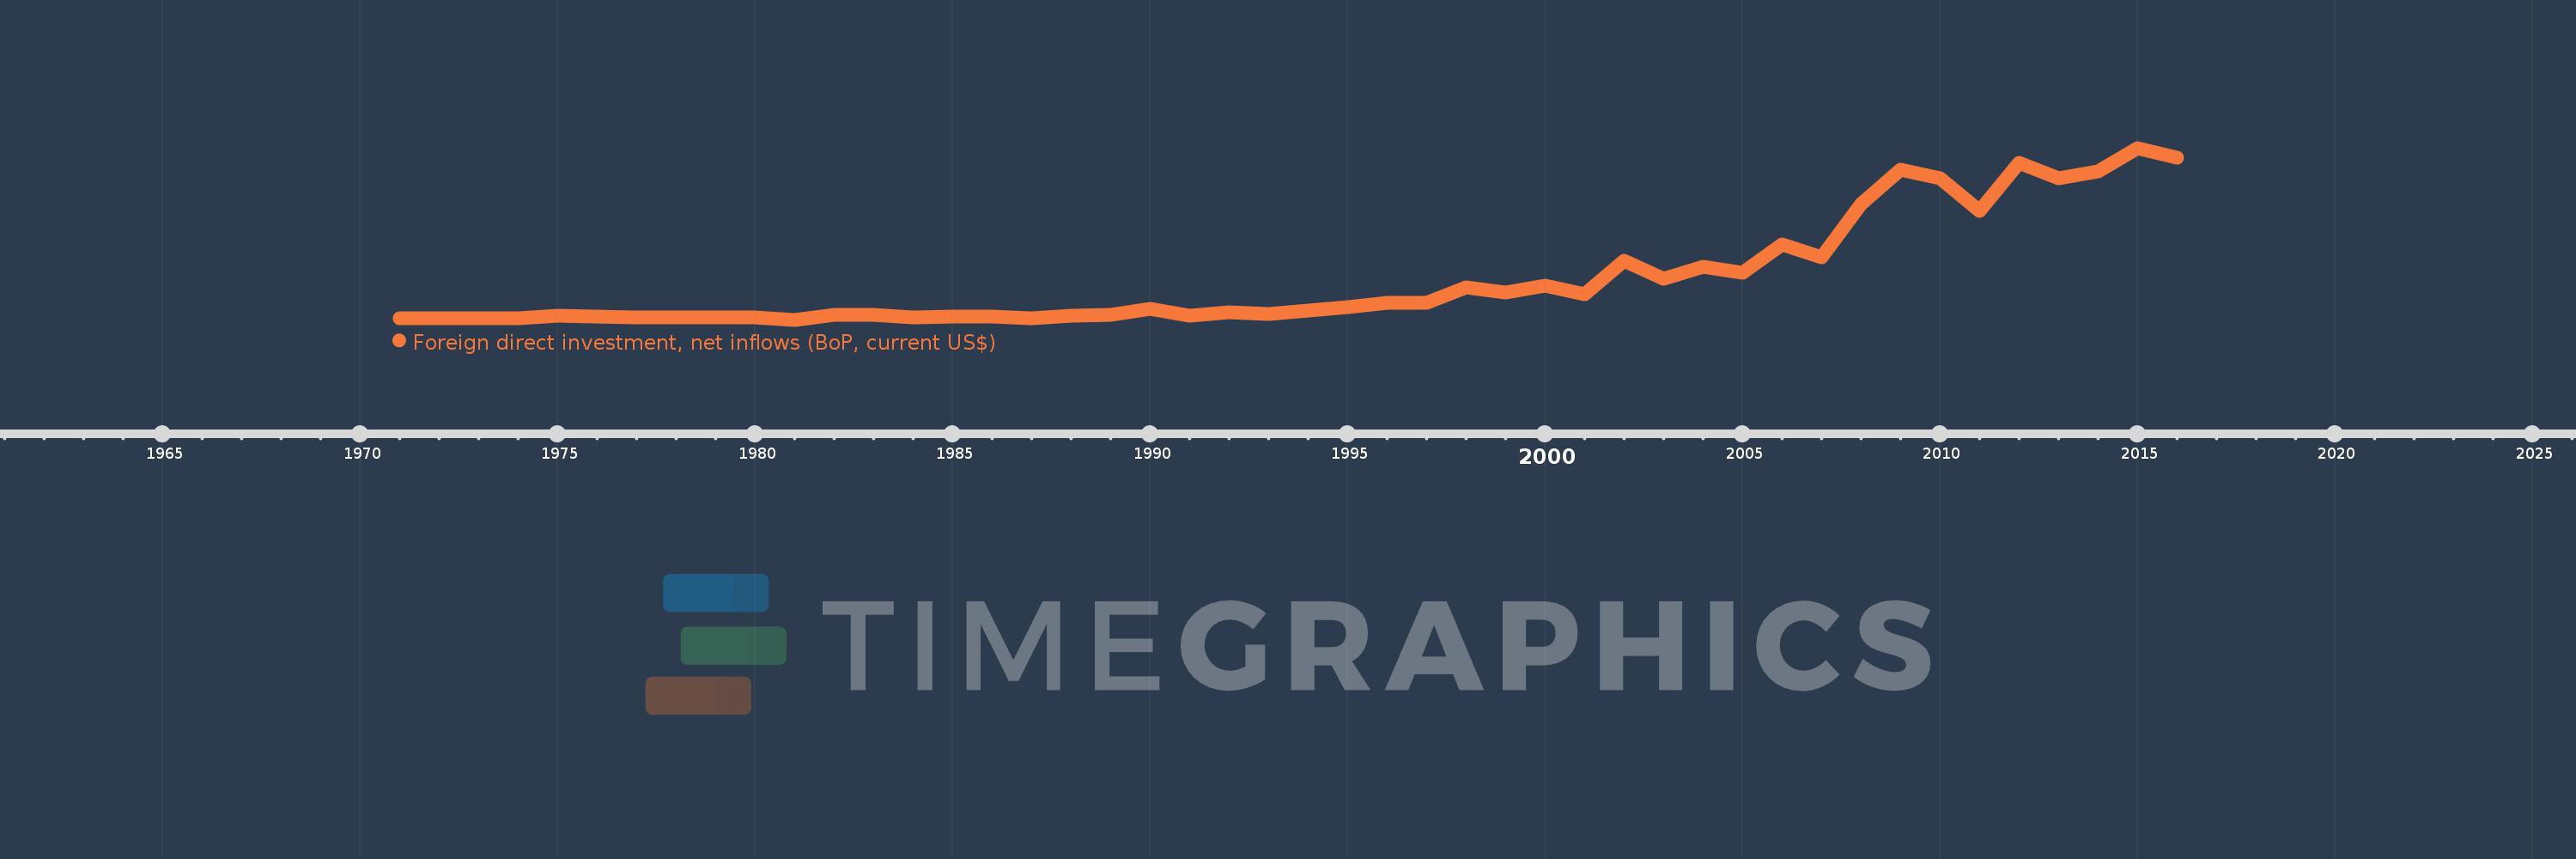
Foreign direct investment, net inflows (BoP, current US$)
2016,2015,2014,2013,2012,2011,2010,2009,2008,2007,2006,2005,2004,2003,2002,2001,2000,1999,1998,1997,1996,1995,1994,1993,1992,1991,1990,1989,1988,1987,1986,1985,1984,1983,1982,1981,1980,1979,1978,1977,1976,1975,1974,1973,1972,1971
Estas estadísticas en otros países:
AfghanistanAlbaniaAlgeriaAngolaAntigua and BarbudaArab WorldArgentinaArmeniaArubaAustraliaAustriaAzerbaijanBahamas, TheBahrainBangladeshBarbadosBelarusBelgiumBelizeBeninBermudaBhutanBoliviaBosnia and HerzegovinaBotswanaBrazilBritish Virgin IslandsBrunei DarussalamBulgariaBurkina FasoBurundiCabo VerdeCambodiaCameroonCanadaCaribbean small statesCayman IslandsCentral African RepublicCentral Europe and the BalticsChadChileChinaColombiaComorosCongo, Dem. Rep.Congo, Rep.Costa RicaCote d'IvoireCroatiaCuracaoCyprusCzech RepublicDenmarkDjiboutiDominicaDominican RepublicEarly-demographic dividendEast Asia & PacificEast Asia & Pacific (excluding high income)East Asia & Pacific (IDA & IBRD countries)EcuadorEgypt, Arab Rep.El SalvadorEquatorial GuineaEritreaEstoniaEthiopiaEuro areaEurope & Central AsiaEurope & Central Asia (excluding high income)Europe & Central Asia (IDA & IBRD countries)European UnionFijiFinlandFragile and conflict affected situationsFranceFrench PolynesiaGabonGambia, TheGeorgiaGermanyGhanaGibraltarGreeceGrenadaGuatemalaGuineaGuinea-BissauGuyanaHaitiHeavily indebted poor countries (HIPC)High incomeHondurasHong Kong SAR, ChinaHungaryIBRD onlyIcelandIDA & IBRD totalIDA blendIDA onlyIDA totalIndiaIndonesiaIran, Islamic Rep.IraqIrelandIsraelItalyJamaicaJapanJordanKazakhstanKenyaKiribatiKorea, Dem. People’s Rep.Korea, Rep.KosovoKuwaitKyrgyz RepublicLao PDRLate-demographic dividendLatin America & Caribbean Latin America & Caribbean (excluding high income)Latin America & the Caribbean (IDA & IBRD countries)LatviaLeast developed countries: UN classificationLebanonLesothoLiberiaLibyaLithuaniaLow & middle incomeLow incomeLower middle incomeLuxembourgMacao SAR, ChinaMacedonia, FYRMadagascarMalawiMalaysiaMaldivesMaliMaltaMarshall IslandsMauritaniaMauritiusMexicoMicronesia, Fed. Sts.Middle East & North AfricaMiddle East & North Africa (excluding high income)Middle East & North Africa (IDA & IBRD countries)Middle incomeMoldovaMongoliaMontenegroMoroccoMozambiqueMyanmarNamibiaNauruNepalNetherlandsNew CaledoniaNew ZealandNicaraguaNigerNigeriaNorth AmericaNorthern Mariana IslandsNorwayOECD membersOmanOther small statesPacific island small statesPakistanPalauPanamaPapua New GuineaParaguayPeruPhilippinesPolandPortugalPost-demographic dividendPre-demographic dividendQatarRomaniaRussian FederationRwandaSamoaSao Tome and PrincipeSaudi ArabiaSenegalSerbiaSeychellesSierra LeoneSingaporeSint Maarten (Dutch part)Slovak RepublicSloveniaSmall statesSolomon IslandsSomaliaSouth AfricaSouth AsiaSouth Asia (IDA & IBRD)South SudanSpainSri LankaSt. Kitts and NevisSt. LuciaSt. Vincent and the GrenadinesSub-Saharan Africa Sub-Saharan Africa (excluding high income)Sub-Saharan Africa (IDA & IBRD countries)SudanSurinameSwazilandSwedenSwitzerlandSyrian Arab RepublicTajikistanTanzaniaThailandTimor-LesteTogoTongaTrinidad and TobagoTunisiaTurkeyTurkmenistanTuvaluUgandaUkraineUnited Arab EmiratesUnited KingdomUnited StatesUpper middle incomeUruguayUzbekistanVanuatuVenezuela, RBVietnamWest Bank and GazaWorldYemen, Rep.ZambiaZimbabwe línea de tiempo (timeline):
En esta escala de tiempo se presenta un gráfico de 1971 y 2016 de Sub-Saharan Africa . Los datos de 1970 están ausentes. El número de observaciones reales por fecha: 46.
Fuente (nombre):
Indicadores del desarrollo mundial
Fuente (organización):
International Monetary Fund, Balance of Payments database, supplemented by data from the United Nations Conference on Trade and Development and official national sources.
Categorías:
Economy & Growth, Financial Sector, External Debt
Se ha actualizado:
23 abr 2017 año
Los indicadores de los cambios de valor en los últimos años
Mínimo:
251.665 millones
1 ene 1981 año
Máximo:
44.439 bn
1 ene 2015 año
A la fecha de observación
Valor
Cambio absoluto
El cambio con respecto al valor anterior
1 ene 1971 año
706.576 millones
+706.576 millones
0.0%
1 ene 1972 año
595.472 millones
-111.104 millones
-15.72%
1 ene 1973 año
573.576 millones
-21.896 millones
-3.68%
1 ene 1974 año
654.443 millones
+80.867 millones
14.1%
1 ene 1975 año
1.2 bn
+545.629 millones
83.37%
1 ene 1976 año
1.049 bn
-150.725 millones
-12.56%
1 ene 1977 año
928.127 millones
-121.219 millones
-11.55%
1 ene 1978 año
811.5 millones
-116.627 millones
-12.57%
1 ene 1979 año
916.469 millones
+104.969 millones
12.94%
1 ene 1980 año
774.406 millones
-142.063 millones
-15.5%
1 ene 1981 año
251.665 millones
-522.74 millones
-67.5%
1 ene 1982 año
1.537 bn
+1.285 bn
510.64%
1 ene 1983 año
1.494 bn
-43.229 millones
-2.81%
1 ene 1984 año
898.625 millones
-594.903 millones
-39.83%
1 ene 1985 año
971.235 millones
+72.61 millones
8.08%
1 ene 1986 año
961.868 millones
-9.367 millones
-0.96%
1 ene 1987 año
629.151 millones
-332.717 millones
-34.59%
1 ene 1988 año
1.364 bn
+734.396 millones
116.73%
1 ene 1989 año
1.536 bn
+172.758 millones
12.67%
1 ene 1990 año
3.036 bn
+1.5 bn
97.61%
1 ene 1991 año
1.228 bn
-1.808 bn
-59.57%
1 ene 1992 año
2.201 bn
+973.608 millones
79.32%
1 ene 1993 año
1.635 bn
-566.432 millones
-25.73%
1 ene 1994 año
2.539 bn
+904.727 millones
55.35%
1 ene 1995 año
3.525 bn
+985.743 millones
38.82%
1 ene 1996 año
4.538 bn
+1.013 bn
28.74%
1 ene 1997 año
4.494 bn
-43.883 millones
-0.97%
1 ene 1998 año
8.554 bn
+4.06 bn
90.33%
1 ene 1999 año
7.156 bn
-1.398 bn
-16.34%
1 ene 2000 año
9.105 bn
+1.949 bn
27.24%
1 ene 2001 año
6.874 bn
-2.231 bn
-24.51%
1 ene 2002 año
15.418 bn
+8.544 bn
124.3%
1 ene 2003 año
10.837 bn
-4.581 bn
-29.71%
1 ene 2004 año
13.817 bn
+2.98 bn
27.5%
1 ene 2005 año
12.294 bn
-1.524 bn
-11.03%
1 ene 2006 año
19.584 bn
+7.29 bn
59.3%
1 ene 2007 año
16.415 bn
-3.169 bn
-16.18%
1 ene 2008 año
29.965 bn
+13.55 bn
82.54%
1 ene 2009 año
38.914 bn
+8.949 bn
29.87%
1 ene 2010 año
36.581 bn
-2.334 bn
-6.0%
1 ene 2011 año
28.283 bn
-8.298 bn
-22.68%
1 ene 2012 año
40.646 bn
+12.363 bn
43.71%
1 ene 2013 año
36.629 bn
-4.017 bn
-9.88%
1 ene 2014 año
38.471 bn
+1.842 bn
5.03%
1 ene 2015 año
44.439 bn
+5.968 bn
15.51%
1 ene 2016 año
42.006 bn
-2.433 bn
-5.47%
Ranking de los países por los datos estadísticos actuales


Comentarios: