29
/es/
es
AIzaSyAYiBZKx7MnpbEhh9jyipgxe19OcubqV5w
April 1, 2024
42369
Latin America & Caribbean (excluding high income)
LAC
false
2
1
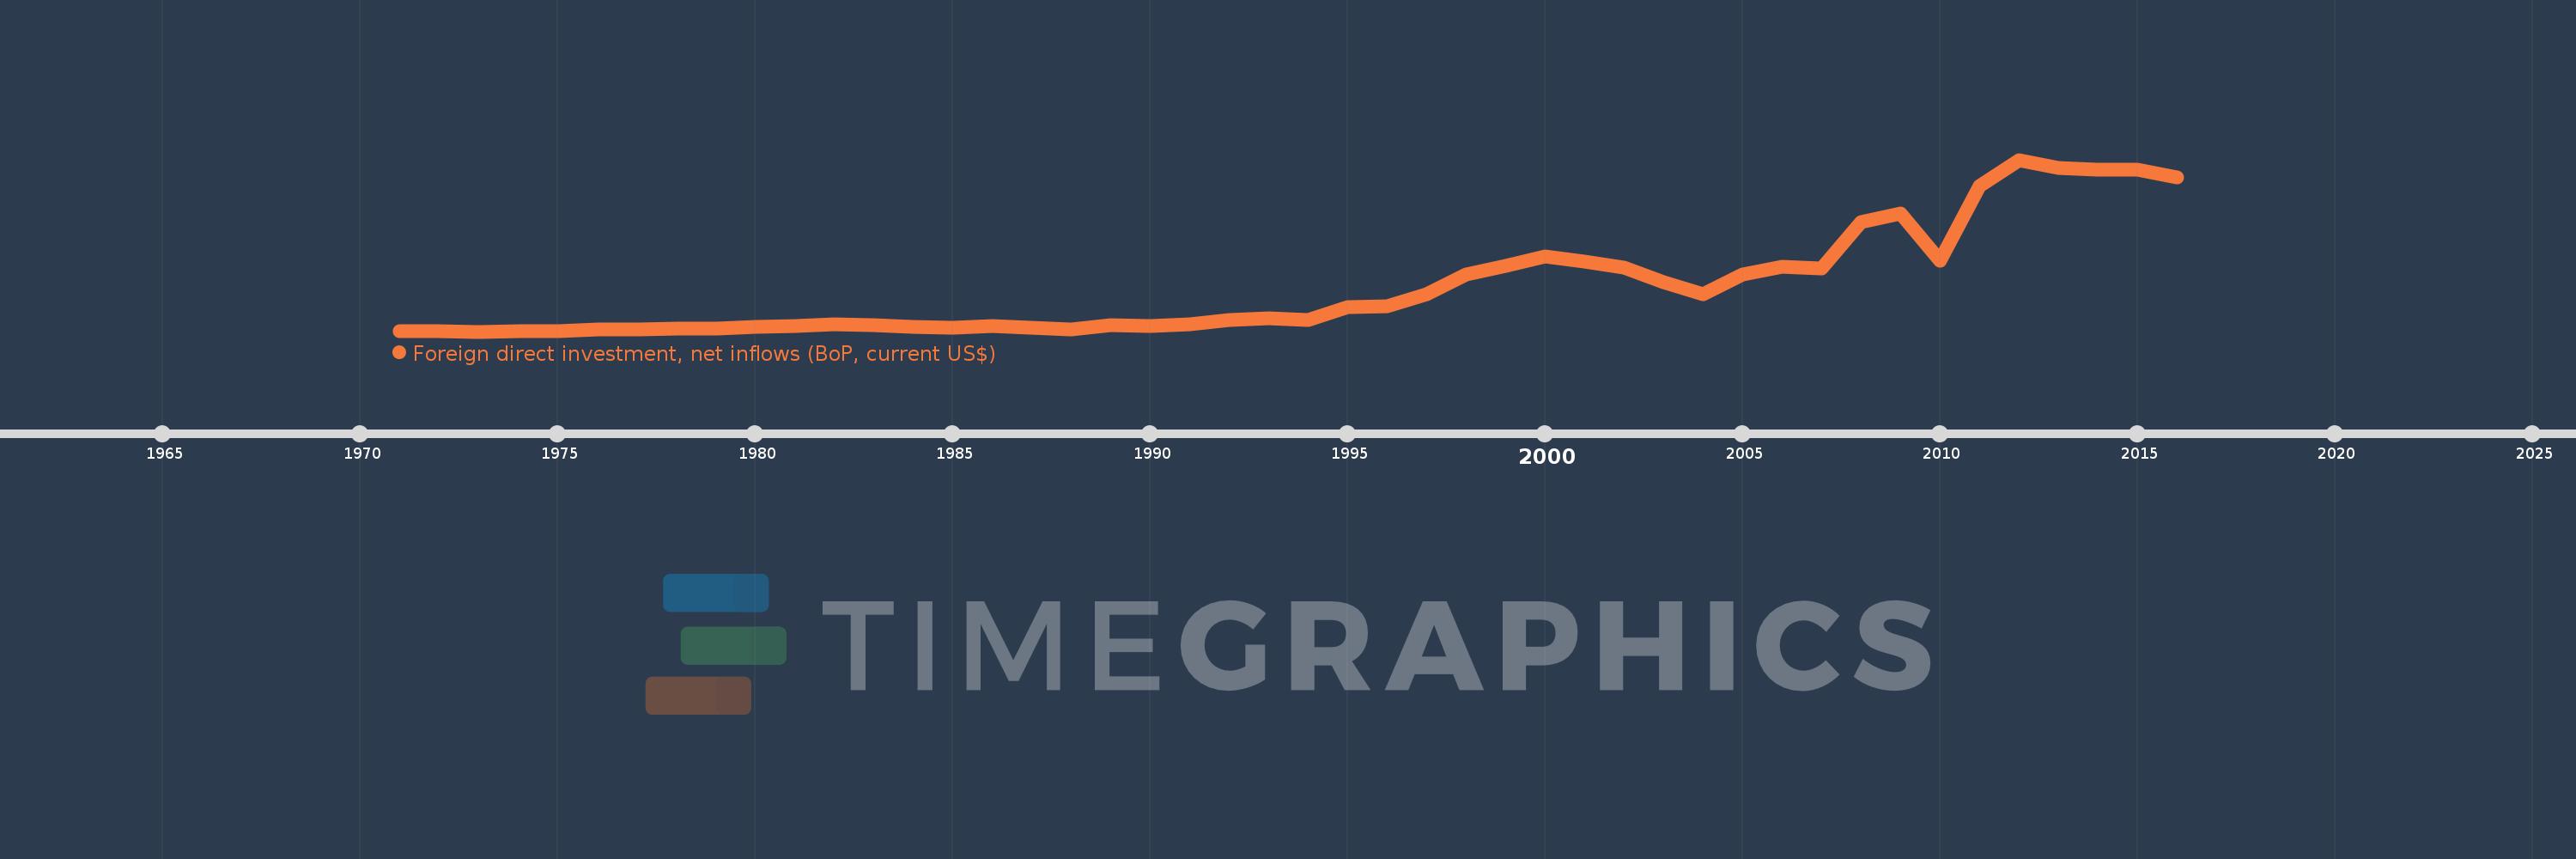
Foreign direct investment, net inflows (BoP, current US$)
2016,2015,2014,2013,2012,2011,2010,2009,2008,2007,2006,2005,2004,2003,2002,2001,2000,1999,1998,1997,1996,1995,1994,1993,1992,1991,1990,1989,1988,1987,1986,1985,1984,1983,1982,1981,1980,1979,1978,1977,1976,1975,1974,1973,1972,1971
Estas estadísticas en otros países:
AfghanistanAlbaniaAlgeriaAngolaAntigua and BarbudaArab WorldArgentinaArmeniaArubaAustraliaAustriaAzerbaijanBahamas, TheBahrainBangladeshBarbadosBelarusBelgiumBelizeBeninBermudaBhutanBoliviaBosnia and HerzegovinaBotswanaBrazilBritish Virgin IslandsBrunei DarussalamBulgariaBurkina FasoBurundiCabo VerdeCambodiaCameroonCanadaCaribbean small statesCayman IslandsCentral African RepublicCentral Europe and the BalticsChadChileChinaColombiaComorosCongo, Dem. Rep.Congo, Rep.Costa RicaCote d'IvoireCroatiaCuracaoCyprusCzech RepublicDenmarkDjiboutiDominicaDominican RepublicEarly-demographic dividendEast Asia & PacificEast Asia & Pacific (excluding high income)East Asia & Pacific (IDA & IBRD countries)EcuadorEgypt, Arab Rep.El SalvadorEquatorial GuineaEritreaEstoniaEthiopiaEuro areaEurope & Central AsiaEurope & Central Asia (excluding high income)Europe & Central Asia (IDA & IBRD countries)European UnionFijiFinlandFragile and conflict affected situationsFranceFrench PolynesiaGabonGambia, TheGeorgiaGermanyGhanaGibraltarGreeceGrenadaGuatemalaGuineaGuinea-BissauGuyanaHaitiHeavily indebted poor countries (HIPC)High incomeHondurasHong Kong SAR, ChinaHungaryIBRD onlyIcelandIDA & IBRD totalIDA blendIDA onlyIDA totalIndiaIndonesiaIran, Islamic Rep.IraqIrelandIsraelItalyJamaicaJapanJordanKazakhstanKenyaKiribatiKorea, Dem. People’s Rep.Korea, Rep.KosovoKuwaitKyrgyz RepublicLao PDRLate-demographic dividendLatin America & Caribbean Latin America & Caribbean (excluding high income)Latin America & the Caribbean (IDA & IBRD countries)LatviaLeast developed countries: UN classificationLebanonLesothoLiberiaLibyaLithuaniaLow & middle incomeLow incomeLower middle incomeLuxembourgMacao SAR, ChinaMacedonia, FYRMadagascarMalawiMalaysiaMaldivesMaliMaltaMarshall IslandsMauritaniaMauritiusMexicoMicronesia, Fed. Sts.Middle East & North AfricaMiddle East & North Africa (excluding high income)Middle East & North Africa (IDA & IBRD countries)Middle incomeMoldovaMongoliaMontenegroMoroccoMozambiqueMyanmarNamibiaNauruNepalNetherlandsNew CaledoniaNew ZealandNicaraguaNigerNigeriaNorth AmericaNorthern Mariana IslandsNorwayOECD membersOmanOther small statesPacific island small statesPakistanPalauPanamaPapua New GuineaParaguayPeruPhilippinesPolandPortugalPost-demographic dividendPre-demographic dividendQatarRomaniaRussian FederationRwandaSamoaSao Tome and PrincipeSaudi ArabiaSenegalSerbiaSeychellesSierra LeoneSingaporeSint Maarten (Dutch part)Slovak RepublicSloveniaSmall statesSolomon IslandsSomaliaSouth AfricaSouth AsiaSouth Asia (IDA & IBRD)South SudanSpainSri LankaSt. Kitts and NevisSt. LuciaSt. Vincent and the GrenadinesSub-Saharan Africa Sub-Saharan Africa (excluding high income)Sub-Saharan Africa (IDA & IBRD countries)SudanSurinameSwazilandSwedenSwitzerlandSyrian Arab RepublicTajikistanTanzaniaThailandTimor-LesteTogoTongaTrinidad and TobagoTunisiaTurkeyTurkmenistanTuvaluUgandaUkraineUnited Arab EmiratesUnited KingdomUnited StatesUpper middle incomeUruguayUzbekistanVanuatuVenezuela, RBVietnamWest Bank and GazaWorldYemen, Rep.ZambiaZimbabwe línea de tiempo (timeline):
En esta escala de tiempo se presenta un gráfico de 1971 y 2016 de Latin America & Caribbean (excluding high income). Los datos de 1970 están ausentes. El número de observaciones reales por fecha: 46.
Fuente (nombre):
Indicadores del desarrollo mundial
Fuente (organización):
International Monetary Fund, Balance of Payments database, supplemented by data from the United Nations Conference on Trade and Development and official national sources.
Categorías:
Economy & Growth, Financial Sector, External Debt
Se ha actualizado:
23 abr 2017 año
Los indicadores de los cambios de valor en los últimos años
Mínimo:
33.131 millones
1 ene 1973 año
Máximo:
180.253 bn
1 ene 2012 año
A la fecha de observación
Valor
Cambio absoluto
El cambio con respecto al valor anterior
1 ene 1971 año
521.123 millones
+521.123 millones
0.0%
1 ene 1972 año
770.818 millones
+249.695 millones
47.91%
1 ene 1973 año
33.131 millones
-737.687 millones
-95.7%
1 ene 1974 año
675.403 millones
+642.272 millones
1.94 mil%
1 ene 1975 año
349.467 millones
-325.936 millones
-48.26%
1 ene 1976 año
2.524 bn
+2.174 bn
622.18%
1 ene 1977 año
1.835 bn
-688.403 millones
-27.28%
1 ene 1978 año
2.742 bn
+906.689 millones
49.4%
1 ene 1979 año
3.476 bn
+733.636 millones
26.75%
1 ene 1980 año
4.657 bn
+1.182 bn
34.0%
1 ene 1981 año
5.701 bn
+1.043 bn
22.4%
1 ene 1982 año
7.918 bn
+2.217 bn
38.9%
1 ene 1983 año
6.355 bn
-1.563 bn
-19.74%
1 ene 1984 año
5.169 bn
-1.186 bn
-18.67%
1 ene 1985 año
4.017 bn
-1.152 bn
-22.28%
1 ene 1986 año
5.841 bn
+1.824 bn
45.4%
1 ene 1987 año
3.99 bn
-1.852 bn
-31.7%
1 ene 1988 año
2.712 bn
-1.278 bn
-32.02%
1 ene 1989 año
6.357 bn
+3.645 bn
134.38%
1 ene 1990 año
6.196 bn
-161.423 millones
-2.54%
1 ene 1991 año
7.293 bn
+1.097 bn
17.71%
1 ene 1992 año
11.863 bn
+4.57 bn
62.66%
1 ene 1993 año
13.62 bn
+1.758 bn
14.82%
1 ene 1994 año
12.275 bn
-1.346 bn
-9.88%
1 ene 1995 año
25.467 bn
+13.192 bn
107.47%
1 ene 1996 año
27.047 bn
+1.58 bn
6.21%
1 ene 1997 año
38.823 bn
+11.776 bn
43.54%
1 ene 1998 año
60.287 bn
+21.464 bn
55.29%
1 ene 1999 año
68.867 bn
+8.58 bn
14.23%
1 ene 2000 año
78.985 bn
+10.117 bn
14.69%
1 ene 2001 año
73.252 bn
-5.732 bn
-7.26%
1 ene 2002 año
66.966 bn
-6.287 bn
-8.58%
1 ene 2003 año
51.766 bn
-15.199 bn
-22.7%
1 ene 2004 año
39.549 bn
-12.218 bn
-23.6%
1 ene 2005 año
59.856 bn
+20.307 bn
51.35%
1 ene 2006 año
68.304 bn
+8.448 bn
14.11%
1 ene 2007 año
66.535 bn
-1.769 bn
-2.59%
1 ene 2008 año
114.524 bn
+47.989 bn
72.13%
1 ene 2009 año
123.909 bn
+9.385 bn
8.19%
1 ene 2010 año
74.588 bn
-49.321 bn
-39.8%
1 ene 2011 año
152.484 bn
+77.896 bn
104.44%
1 ene 2012 año
180.253 bn
+27.769 bn
18.21%
1 ene 2013 año
171.292 bn
-8.962 bn
-4.97%
1 ene 2014 año
170.153 bn
-1.139 bn
-0.66%
1 ene 2015 año
170.039 bn
-113.54 millones
-0.07%
1 ene 2016 año
161.475 bn
-8.564 bn
-5.04%
Ranking de los países por los datos estadísticos actuales


Comentarios: