29
/es/
es
AIzaSyAYiBZKx7MnpbEhh9jyipgxe19OcubqV5w
April 1, 2024
58308
South Asia (IDA & IBRD)
TSA
false
2
1
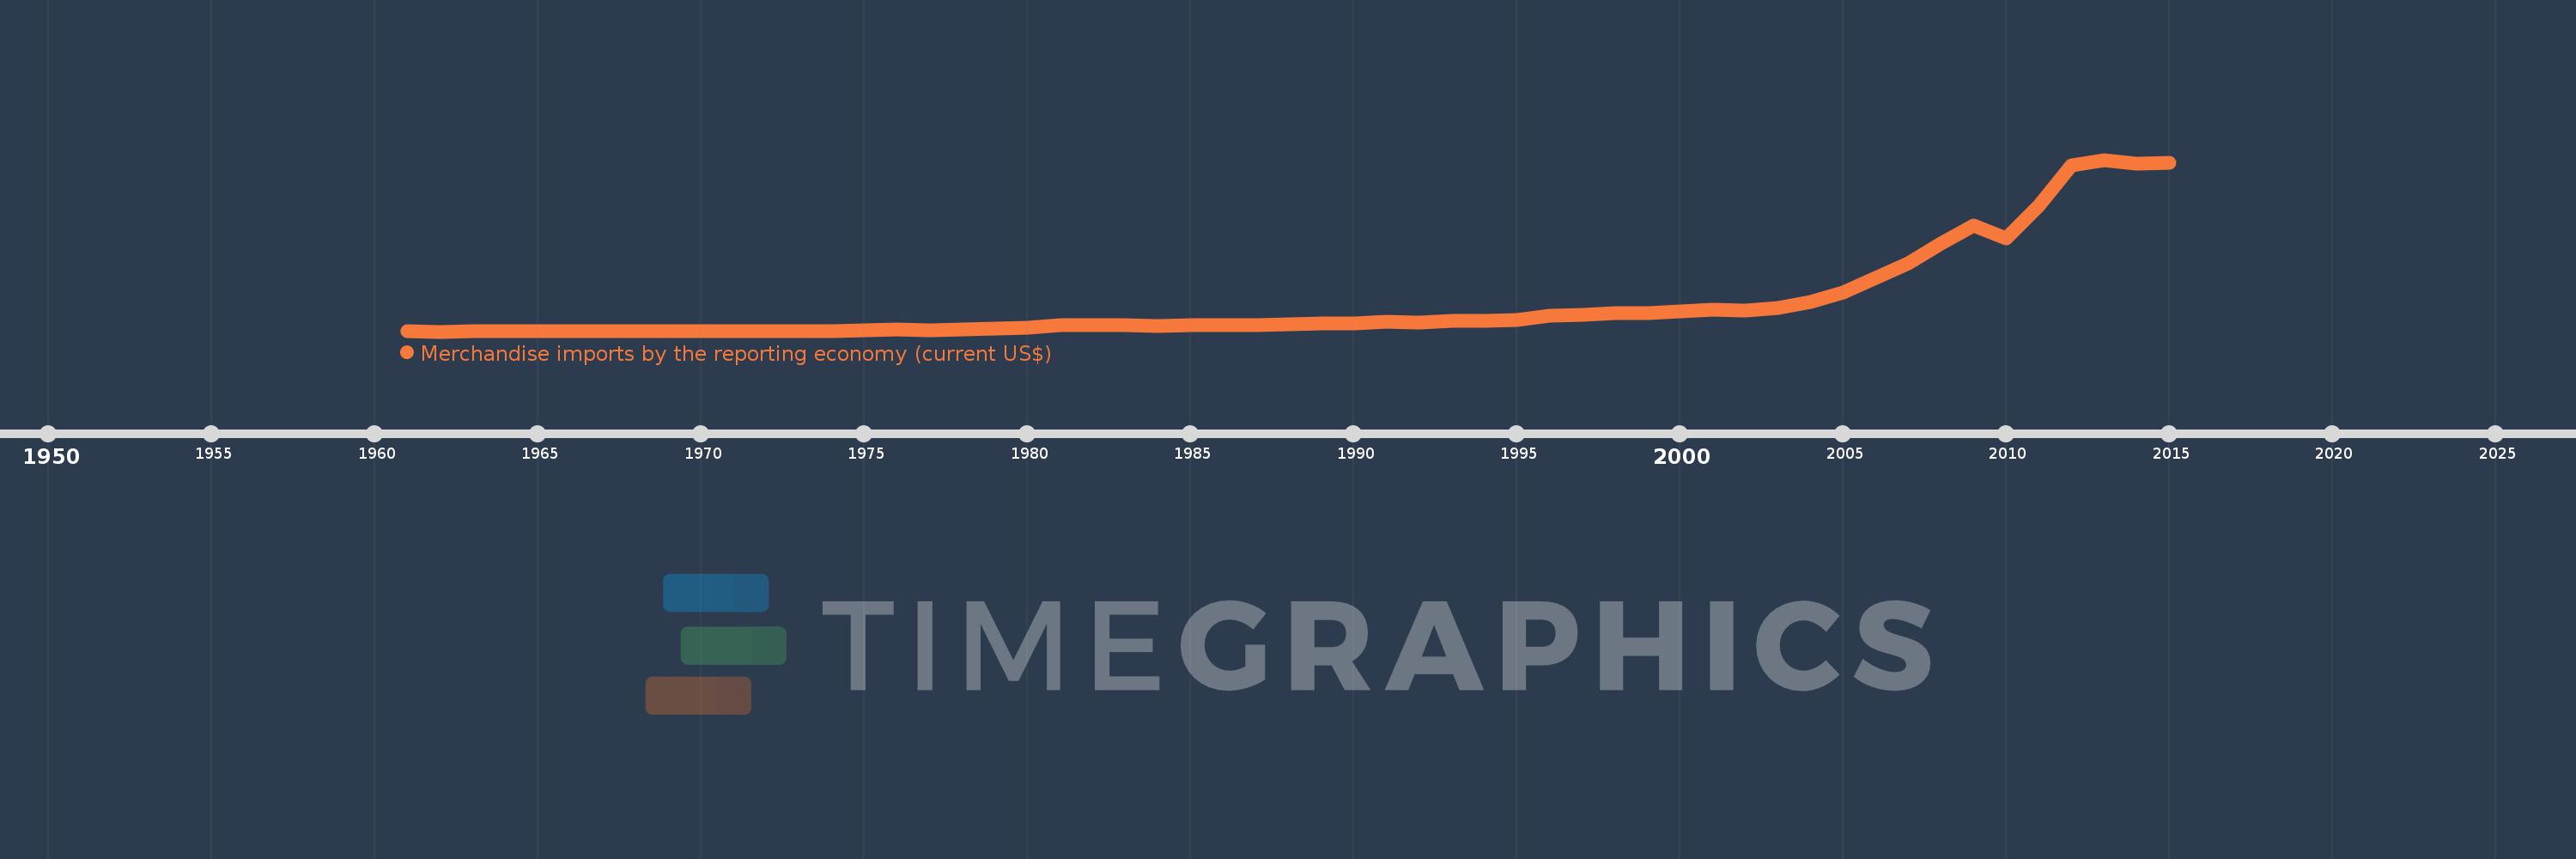
Merchandise imports by the reporting economy (current US$)
2015,2014,2013,2012,2011,2010,2009,2008,2007,2006,2005,2004,2003,2002,2001,2000,1999,1998,1997,1996,1995,1994,1993,1992,1991,1990,1989,1988,1987,1986,1985,1984,1983,1982,1981,1980,1979,1978,1977,1976,1975,1974,1973,1972,1971,1970,1969,1968,1967,1966,1965,1964,1963,1962,1961
Estas estadísticas en otros países:
AfghanistanAlbaniaAlgeriaAmerican SamoaAngolaAntigua and BarbudaArab WorldArgentinaArmeniaArubaAustraliaAustriaAzerbaijanBahamas, TheBahrainBangladeshBarbadosBelarusBelgiumBelizeBeninBermudaBoliviaBosnia and HerzegovinaBrazilBrunei DarussalamBulgariaBurkina FasoBurundiCabo VerdeCambodiaCameroonCanadaCaribbean small statesCentral African RepublicCentral Europe and the BalticsChadChileChinaColombiaComorosCongo, Dem. Rep.Congo, Rep.Costa RicaCote d'IvoireCroatiaCubaCyprusCzech RepublicDenmarkDjiboutiDominicaDominican RepublicEarly-demographic dividendEast Asia & PacificEast Asia & Pacific (excluding high income)East Asia & Pacific (IDA & IBRD countries)EcuadorEgypt, Arab Rep.El SalvadorEquatorial GuineaEstoniaEthiopiaEuro areaEurope & Central AsiaEurope & Central Asia (excluding high income)Europe & Central Asia (IDA & IBRD countries)European UnionFaroe IslandsFijiFinlandFragile and conflict affected situationsFranceFrench PolynesiaGabonGambia, TheGeorgiaGermanyGhanaGibraltarGreeceGreenlandGrenadaGuamGuatemalaGuineaGuinea-BissauGuyanaHaitiHeavily indebted poor countries (HIPC)High incomeHondurasHong Kong SAR, ChinaHungaryIBRD onlyIcelandIDA & IBRD totalIDA blendIDA onlyIDA totalIndiaIndonesiaIran, Islamic Rep.IraqIrelandIsraelItalyJamaicaJapanJordanKazakhstanKenyaKiribatiKorea, Dem. People’s Rep.Korea, Rep.KosovoKuwaitKyrgyz RepublicLao PDRLate-demographic dividendLatin America & Caribbean Latin America & Caribbean (excluding high income)Latin America & the Caribbean (IDA & IBRD countries)LatviaLeast developed countries: UN classificationLebanonLiberiaLibyaLithuaniaLow & middle incomeLow incomeLower middle incomeLuxembourgMacao SAR, ChinaMacedonia, FYRMadagascarMalawiMalaysiaMaldivesMaliMaltaMauritaniaMauritiusMexicoMiddle East & North AfricaMiddle East & North Africa (excluding high income)Middle East & North Africa (IDA & IBRD countries)Middle incomeMoldovaMongoliaMontenegroMoroccoMozambiqueMyanmarNauruNepalNetherlandsNew CaledoniaNew ZealandNicaraguaNigerNigeriaNorth AmericaNorwayOECD membersOmanOther small statesPacific island small statesPakistanPanamaPapua New GuineaParaguayPeruPhilippinesPolandPortugalPost-demographic dividendPre-demographic dividendQatarRomaniaRussian FederationRwandaSamoaSao Tome and PrincipeSaudi ArabiaSenegalSerbiaSeychellesSierra LeoneSingaporeSlovak RepublicSloveniaSmall statesSolomon IslandsSomaliaSouth AfricaSouth AsiaSouth Asia (IDA & IBRD)SpainSri LankaSt. Kitts and NevisSt. LuciaSt. Vincent and the GrenadinesSub-Saharan Africa Sub-Saharan Africa (excluding high income)Sub-Saharan Africa (IDA & IBRD countries)SudanSurinameSwedenSwitzerlandSyrian Arab RepublicTajikistanTanzaniaThailandTogoTongaTrinidad and TobagoTunisiaTurkeyTurkmenistanTuvaluUgandaUkraineUnited Arab EmiratesUnited KingdomUnited StatesUpper middle incomeUruguayUzbekistanVanuatuVenezuela, RBVietnamWorldYemen, Rep.ZambiaZimbabwe línea de tiempo (timeline):
En esta escala de tiempo se presenta un gráfico de 1961 y 2015 de South Asia (IDA & IBRD). Los datos de 1960 están ausentes. El número de observaciones reales por fecha: 55.
Fuente (nombre):
Indicadores del desarrollo mundial
Fuente (organización):
World Bank staff estimates based data from International Monetary Fund's Direction of Trade database.
Categorías:
Private Sector, Trade
Se ha actualizado:
23 abr 2017 año
Los indicadores de los cambios de valor en los últimos años
Mínimo:
3.201 bn
1 ene 1962 año
Máximo:
610.084 bn
1 ene 2013 año
A la fecha de observación
Valor
Cambio absoluto
El cambio con respecto al valor anterior
1 ene 1961 año
3.302 bn
+3.302 bn
0.0%
1 ene 1962 año
3.201 bn
-100.5 millones
-3.04%
1 ene 1963 año
3.386 bn
+185.1 millones
5.78%
1 ene 1964 año
3.636 bn
+249.3 millones
7.36%
1 ene 1965 año
4.197 bn
+561.4 millones
15.44%
1 ene 1966 año
4.245 bn
+47.7 millones
1.14%
1 ene 1967 año
4.057 bn
-188.1 millones
-4.43%
1 ene 1968 año
4.269 bn
+211.864 millones
5.22%
1 ene 1969 año
4.045 bn
-223.35 millones
-5.23%
1 ene 1970 año
3.675 bn
-370.148 millones
-9.15%
1 ene 1971 año
3.695 bn
+19.775 millones
0.54%
1 ene 1972 año
3.801 bn
+105.822 millones
2.86%
1 ene 1973 año
3.237 bn
-564.189 millones
-14.84%
1 ene 1974 año
5.753 bn
+2.516 bn
77.73%
1 ene 1975 año
8.841 bn
+3.088 bn
53.68%
1 ene 1976 año
10.73 bn
+1.89 bn
21.37%
1 ene 1977 año
9.026 bn
-1.704 bn
-15.88%
1 ene 1978 año
11.338 bn
+2.312 bn
25.61%
1 ene 1979 año
13.998 bn
+2.66 bn
23.47%
1 ene 1980 año
17.887 bn
+3.889 bn
27.78%
1 ene 1981 año
25.306 bn
+7.419 bn
41.47%
1 ene 1982 año
25.532 bn
+226.718 millones
0.9%
1 ene 1983 año
25.892 bn
+359.899 millones
1.41%
1 ene 1984 año
23.984 bn
-1.909 bn
-7.37%
1 ene 1985 año
26.237 bn
+2.253 bn
9.4%
1 ene 1986 año
27.337 bn
+1.1 bn
4.19%
1 ene 1987 año
25.788 bn
-1.549 bn
-5.67%
1 ene 1988 año
28.689 bn
+2.901 bn
11.25%
1 ene 1989 año
32.117 bn
+3.427 bn
11.95%
1 ene 1990 año
33.108 bn
+990.941 millones
3.09%
1 ene 1991 año
38.871 bn
+5.763 bn
17.41%
1 ene 1992 año
35.528 bn
-3.343 bn
-8.6%
1 ene 1993 año
40.84 bn
+5.312 bn
14.95%
1 ene 1994 año
39.98 bn
-860.025 millones
-2.11%
1 ene 1995 año
44.433 bn
+4.453 bn
11.14%
1 ene 1996 año
58.436 bn
+14.003 bn
31.51%
1 ene 1997 año
62.189 bn
+3.753 bn
6.42%
1 ene 1998 año
67.38 bn
+5.191 bn
8.35%
1 ene 1999 año
67.354 bn
-26.182 millones
-0.04%
1 ene 2000 año
74.898 bn
+7.544 bn
11.2%
1 ene 2001 año
79.327 bn
+4.429 bn
5.91%
1 ene 2002 año
77.566 bn
-1.761 bn
-2.22%
1 ene 2003 año
86.841 bn
+9.275 bn
11.96%
1 ene 2004 año
107.301 bn
+20.459 bn
23.56%
1 ene 2005 año
141.634 bn
+34.333 bn
32.0%
1 ene 2006 año
193.781 bn
+52.147 bn
36.82%
1 ene 2007 año
244.28 bn
+50.499 bn
26.06%
1 ene 2008 año
313.747 bn
+69.467 bn
28.44%
1 ene 2009 año
376.72 bn
+62.973 bn
20.07%
1 ene 2010 año
331.931 bn
-44.789 bn
-11.89%
1 ene 2011 año
448.589 bn
+116.658 bn
35.15%
1 ene 2012 año
590.159 bn
+141.569 bn
31.56%
1 ene 2013 año
610.084 bn
+19.925 bn
3.38%
1 ene 2014 año
595.05 bn
-15.033 bn
-2.46%
1 ene 2015 año
599.076 bn
+4.026 bn
0.68%
Ranking de los países por los datos estadísticos actuales


Comentarios: