29
/es/
es
AIzaSyAYiBZKx7MnpbEhh9jyipgxe19OcubqV5w
April 1, 2024
36768
IBRD only
IBD
false
2
1
Merchandise imports by the reporting economy (current US$)
2015,2014,2013,2012,2011,2010,2009,2008,2007,2006,2005,2004,2003,2002,2001,2000,1999,1998,1997,1996,1995,1994,1993,1992,1991,1990,1989,1988,1987,1986,1985,1984,1983,1982,1981,1980,1979,1978,1977,1976,1975,1974,1973,1972,1971,1970,1969,1968,1967,1966,1965,1964,1963,1962,1961
Estas estadísticas en otros países:
AfghanistanAlbaniaAlgeriaAmerican SamoaAngolaAntigua and BarbudaArab WorldArgentinaArmeniaArubaAustraliaAustriaAzerbaijanBahamas, TheBahrainBangladeshBarbadosBelarusBelgiumBelizeBeninBermudaBoliviaBosnia and HerzegovinaBrazilBrunei DarussalamBulgariaBurkina FasoBurundiCabo VerdeCambodiaCameroonCanadaCaribbean small statesCentral African RepublicCentral Europe and the BalticsChadChileChinaColombiaComorosCongo, Dem. Rep.Congo, Rep.Costa RicaCote d'IvoireCroatiaCubaCyprusCzech RepublicDenmarkDjiboutiDominicaDominican RepublicEarly-demographic dividendEast Asia & PacificEast Asia & Pacific (excluding high income)East Asia & Pacific (IDA & IBRD countries)EcuadorEgypt, Arab Rep.El SalvadorEquatorial GuineaEstoniaEthiopiaEuro areaEurope & Central AsiaEurope & Central Asia (excluding high income)Europe & Central Asia (IDA & IBRD countries)European UnionFaroe IslandsFijiFinlandFragile and conflict affected situationsFranceFrench PolynesiaGabonGambia, TheGeorgiaGermanyGhanaGibraltarGreeceGreenlandGrenadaGuamGuatemalaGuineaGuinea-BissauGuyanaHaitiHeavily indebted poor countries (HIPC)High incomeHondurasHong Kong SAR, ChinaHungaryIBRD onlyIcelandIDA & IBRD totalIDA blendIDA onlyIDA totalIndiaIndonesiaIran, Islamic Rep.IraqIrelandIsraelItalyJamaicaJapanJordanKazakhstanKenyaKiribatiKorea, Dem. People’s Rep.Korea, Rep.KosovoKuwaitKyrgyz RepublicLao PDRLate-demographic dividendLatin America & Caribbean Latin America & Caribbean (excluding high income)Latin America & the Caribbean (IDA & IBRD countries)LatviaLeast developed countries: UN classificationLebanonLiberiaLibyaLithuaniaLow & middle incomeLow incomeLower middle incomeLuxembourgMacao SAR, ChinaMacedonia, FYRMadagascarMalawiMalaysiaMaldivesMaliMaltaMauritaniaMauritiusMexicoMiddle East & North AfricaMiddle East & North Africa (excluding high income)Middle East & North Africa (IDA & IBRD countries)Middle incomeMoldovaMongoliaMontenegroMoroccoMozambiqueMyanmarNauruNepalNetherlandsNew CaledoniaNew ZealandNicaraguaNigerNigeriaNorth AmericaNorwayOECD membersOmanOther small statesPacific island small statesPakistanPanamaPapua New GuineaParaguayPeruPhilippinesPolandPortugalPost-demographic dividendPre-demographic dividendQatarRomaniaRussian FederationRwandaSamoaSao Tome and PrincipeSaudi ArabiaSenegalSerbiaSeychellesSierra LeoneSingaporeSlovak RepublicSloveniaSmall statesSolomon IslandsSomaliaSouth AfricaSouth AsiaSouth Asia (IDA & IBRD)SpainSri LankaSt. Kitts and NevisSt. LuciaSt. Vincent and the GrenadinesSub-Saharan Africa Sub-Saharan Africa (excluding high income)Sub-Saharan Africa (IDA & IBRD countries)SudanSurinameSwedenSwitzerlandSyrian Arab RepublicTajikistanTanzaniaThailandTogoTongaTrinidad and TobagoTunisiaTurkeyTurkmenistanTuvaluUgandaUkraineUnited Arab EmiratesUnited KingdomUnited StatesUpper middle incomeUruguayUzbekistanVanuatuVenezuela, RBVietnamWorldYemen, Rep.ZambiaZimbabwe línea de tiempo (timeline):
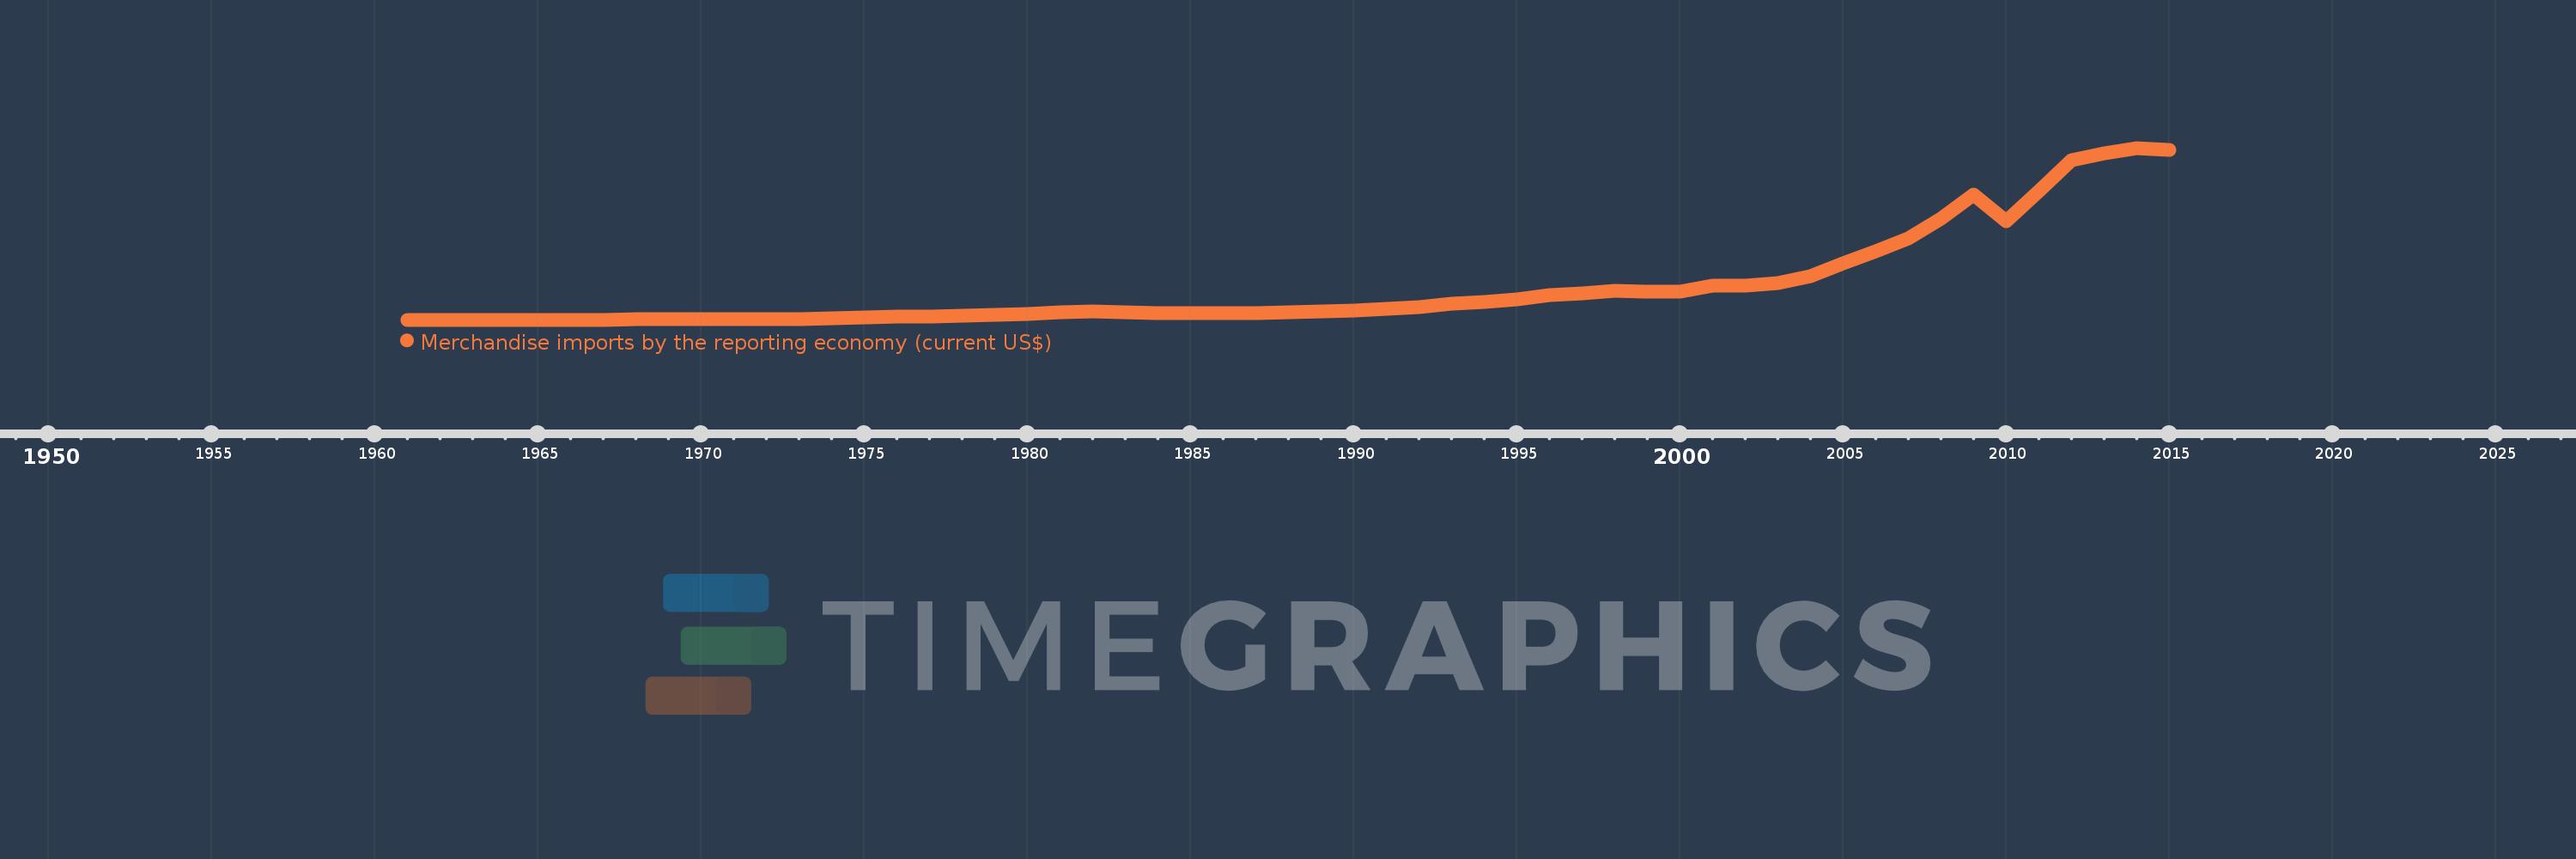
En esta escala de tiempo se presenta un gráfico de 1961 y 2015 de IBRD only. Los datos de 1960 están ausentes. El número de observaciones reales por fecha: 55.
Fuente (nombre):
Indicadores del desarrollo mundial
Fuente (organización):
World Bank staff estimates based data from International Monetary Fund's Direction of Trade database.
Categorías:
Private Sector, Trade
Se ha actualizado:
23 abr 2017 año
Los indicadores de los cambios de valor en los últimos años
En promedio:
1.143 billones
Mínimo:
16.984 bn
1 ene 1963 año
Máximo:
5.956 billones
1 ene 2014 año
A la fecha de observación
Valor
Cambio absoluto
El cambio con respecto al valor anterior
1 ene 1961 año
17.545 bn
+17.545 bn
0.0%
1 ene 1962 año
18.76 bn
+1.215 bn
6.92%
1 ene 1963 año
16.984 bn
-1.777 bn
-9.47%
1 ene 1964 año
17.811 bn
+827.75 millones
4.87%
1 ene 1965 año
20.203 bn
+2.391 bn
13.43%
1 ene 1966 año
20.411 bn
+208.083 millones
1.03%
1 ene 1967 año
22.745 bn
+2.334 bn
11.44%
1 ene 1968 año
24.981 bn
+2.236 bn
9.83%
1 ene 1969 año
26.965 bn
+1.984 bn
7.94%
1 ene 1970 año
28.128 bn
+1.163 bn
4.31%
1 ene 1971 año
33.894 bn
+5.766 bn
20.5%
1 ene 1972 año
37.694 bn
+3.8 bn
11.21%
1 ene 1973 año
44.222 bn
+6.528 bn
17.32%
1 ene 1974 año
64.452 bn
+20.23 bn
45.75%
1 ene 1975 año
104.587 bn
+40.135 bn
62.27%
1 ene 1976 año
124.033 bn
+19.446 bn
18.59%
1 ene 1977 año
129.517 bn
+5.484 bn
4.42%
1 ene 1978 año
149.336 bn
+19.819 bn
15.3%
1 ene 1979 año
174.665 bn
+25.329 bn
16.96%
1 ene 1980 año
201.709 bn
+27.043 bn
15.48%
1 ene 1981 año
260.727 bn
+59.018 bn
29.26%
1 ene 1982 año
307.84 bn
+47.113 bn
18.07%
1 ene 1983 año
275.906 bn
-31.934 bn
-10.37%
1 ene 1984 año
249.208 bn
-26.698 bn
-9.68%
1 ene 1985 año
251.453 bn
+2.245 bn
0.9%
1 ene 1986 año
255.361 bn
+3.908 bn
1.55%
1 ene 1987 año
249.914 bn
-5.447 bn
-2.13%
1 ene 1988 año
271.594 bn
+21.68 bn
8.67%
1 ene 1989 año
317.802 bn
+46.208 bn
17.01%
1 ene 1990 año
348.599 bn
+30.797 bn
9.69%
1 ene 1991 año
398.018 bn
+49.419 bn
14.18%
1 ene 1992 año
454.673 bn
+56.655 bn
14.23%
1 ene 1993 año
563.528 bn
+108.855 bn
23.94%
1 ene 1994 año
616.971 bn
+53.443 bn
9.48%
1 ene 1995 año
710.63 bn
+93.659 bn
15.18%
1 ene 1996 año
870.601 bn
+159.97 bn
22.51%
1 ene 1997 año
935.16 bn
+64.56 bn
7.42%
1 ene 1998 año
1.016 billones
+80.75 bn
8.63%
1 ene 1999 año
991.362 bn
-24.548 bn
-2.42%
1 ene 2000 año
995.29 bn
+3.929 bn
0.4%
1 ene 2001 año
1.197 billones
+201.294 bn
20.22%
1 ene 2002 año
1.19 billones
-6.752 bn
-0.56%
1 ene 2003 año
1.276 billones
+85.726 bn
7.2%
1 ene 2004 año
1.524 billones
+248.5 bn
19.48%
1 ene 2005 año
1.978 billones
+453.887 bn
29.78%
1 ene 2006 año
2.37 billones
+391.961 bn
19.82%
1 ene 2007 año
2.842 billones
+471.732 bn
19.91%
1 ene 2008 año
3.503 billones
+661.048 bn
23.26%
1 ene 2009 año
4.332 billones
+829.076 bn
23.67%
1 ene 2010 año
3.414 billones
-917.337 bn
-21.18%
1 ene 2011 año
4.449 billones
+1.035 billones
30.31%
1 ene 2012 año
5.529 billones
+1.08 billones
24.27%
1 ene 2013 año
5.768 billones
+238.597 bn
4.31%
1 ene 2014 año
5.956 billones
+187.909 bn
3.26%
1 ene 2015 año
5.892 billones
-64.367 bn
-1.08%
Ranking de los países por los datos estadísticos actuales


Comentarios: