29
/es/
es
AIzaSyAYiBZKx7MnpbEhh9jyipgxe19OcubqV5w
April 1, 2024
58289
South Asia (IDA & IBRD)
TSA
false
2
1
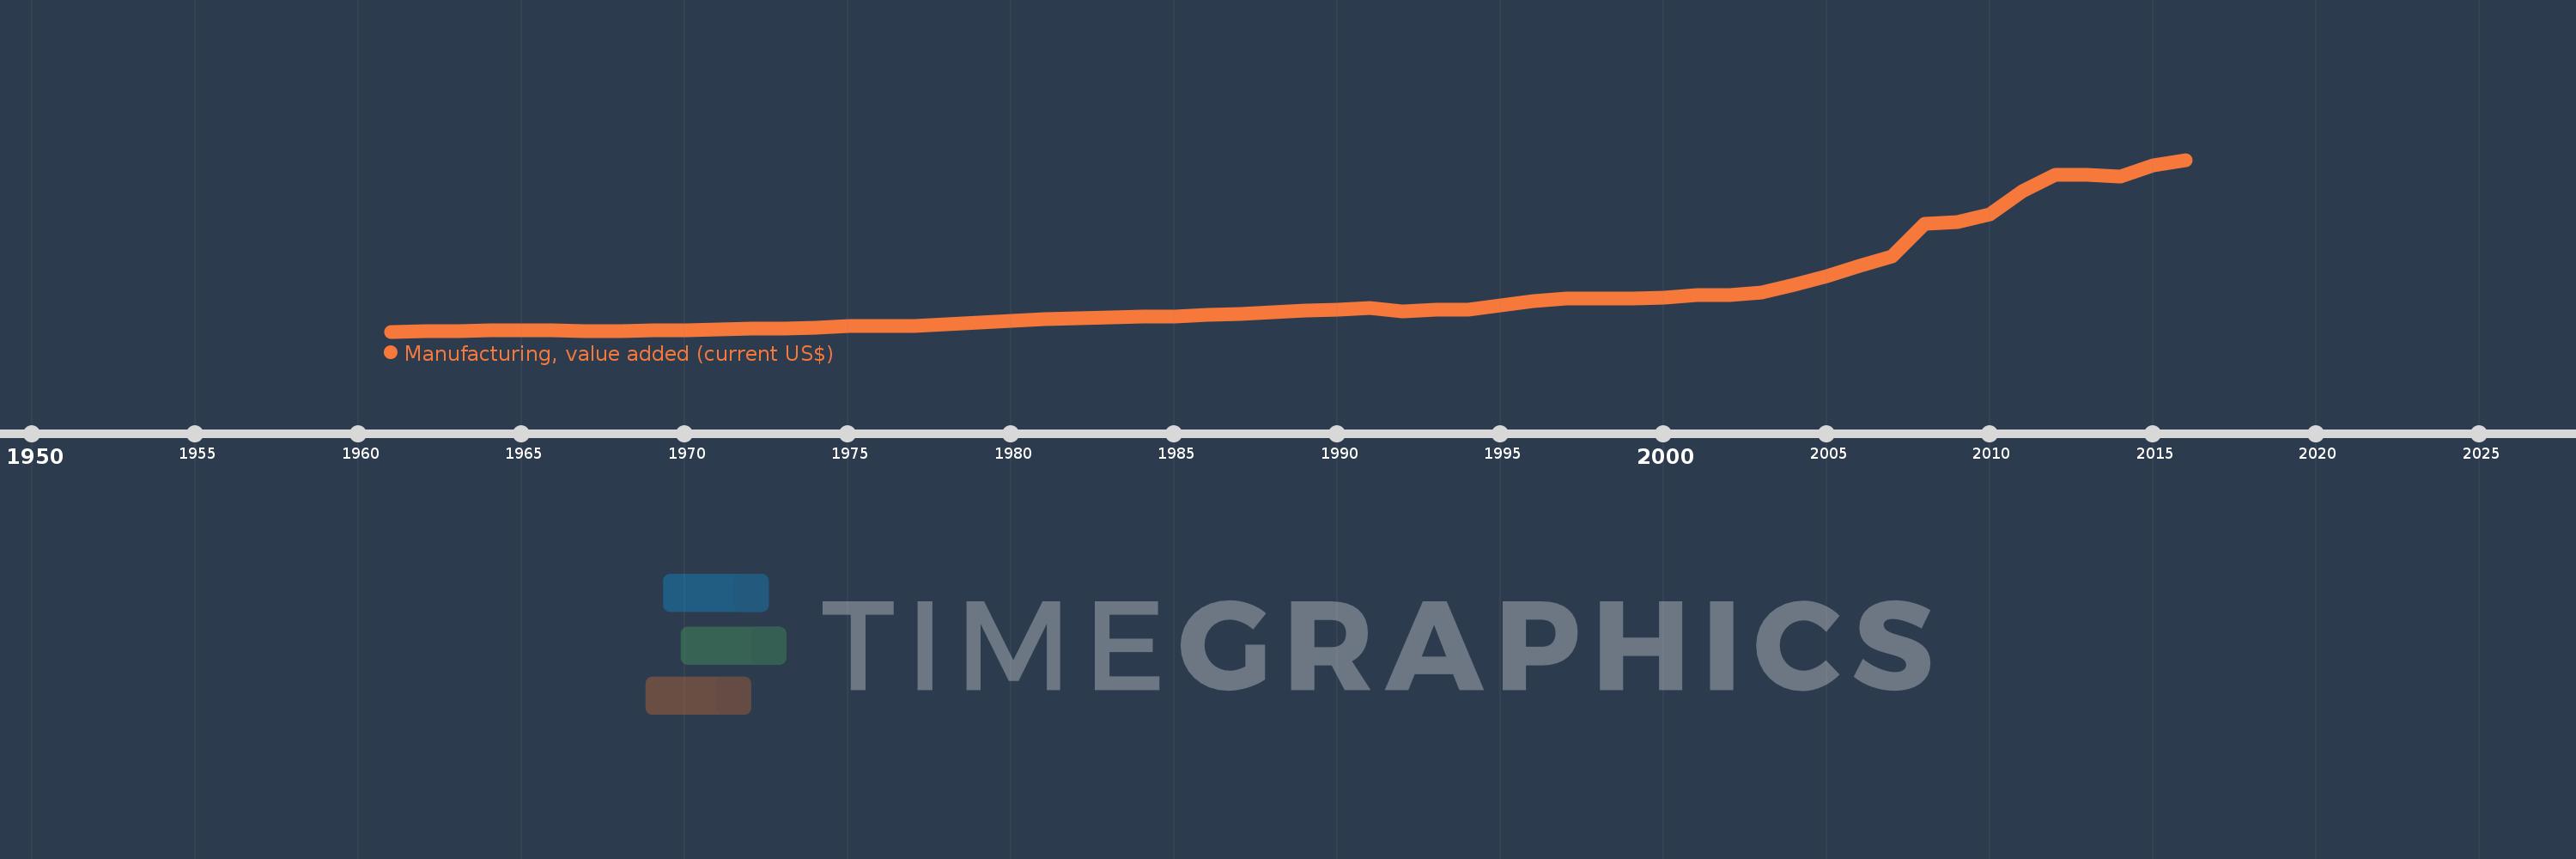
Manufacturing, value added (current US$)
2016,2015,2014,2013,2012,2011,2010,2009,2008,2007,2006,2005,2004,2003,2002,2001,2000,1999,1998,1997,1996,1995,1994,1993,1992,1991,1990,1989,1988,1987,1986,1985,1984,1983,1982,1981,1980,1979,1978,1977,1976,1975,1974,1973,1972,1971,1970,1969,1968,1967,1966,1965,1964,1963,1962,1961
Estas estadísticas en otros países:
AfghanistanAlbaniaAlgeriaAndorraAngolaAntigua and BarbudaArab WorldArgentinaArmeniaArubaAustraliaAustriaAzerbaijanBahamas, TheBahrainBangladeshBarbadosBelarusBelgiumBelizeBeninBermudaBhutanBoliviaBosnia and HerzegovinaBotswanaBrazilBrunei DarussalamBurkina FasoBurundiCabo VerdeCambodiaCameroonCanadaCaribbean small statesCayman IslandsCentral African RepublicCentral Europe and the BalticsChadChileChinaColombiaComorosCongo, Dem. Rep.Congo, Rep.Costa RicaCote d'IvoireCroatiaCubaCyprusCzech RepublicDenmarkDjiboutiDominicaDominican RepublicEarly-demographic dividendEast Asia & PacificEast Asia & Pacific (excluding high income)East Asia & Pacific (IDA & IBRD countries)EcuadorEgypt, Arab Rep.El SalvadorEquatorial GuineaEritreaEstoniaEthiopiaEuro areaEurope & Central AsiaEurope & Central Asia (excluding high income)Europe & Central Asia (IDA & IBRD countries)European UnionFaroe IslandsFijiFinlandFragile and conflict affected situationsFranceGabonGambia, TheGeorgiaGermanyGhanaGreeceGrenadaGuatemalaGuineaGuinea-BissauGuyanaHeavily indebted poor countries (HIPC)High incomeHondurasHong Kong SAR, ChinaHungaryIBRD onlyIcelandIDA & IBRD totalIDA blendIDA onlyIDA totalIndiaIndonesiaIran, Islamic Rep.IraqIrelandItalyJamaicaJapanJordanKazakhstanKenyaKiribatiKorea, Rep.KosovoKuwaitKyrgyz RepublicLao PDRLate-demographic dividendLatin America & Caribbean Latin America & Caribbean (excluding high income)Latin America & the Caribbean (IDA & IBRD countries)LatviaLeast developed countries: UN classificationLebanonLesothoLiberiaLibyaLithuaniaLow & middle incomeLow incomeLower middle incomeLuxembourgMacao SAR, ChinaMacedonia, FYRMadagascarMalawiMalaysiaMaldivesMaliMaltaMarshall IslandsMauritaniaMauritiusMexicoMicronesia, Fed. Sts.Middle East & North AfricaMiddle East & North Africa (excluding high income)Middle East & North Africa (IDA & IBRD countries)Middle incomeMoldovaMongoliaMontenegroMoroccoMozambiqueMyanmarNamibiaNepalNetherlandsNew CaledoniaNew ZealandNicaraguaNigerNigeriaNorth AmericaNorwayOECD membersOmanOther small statesPacific island small statesPakistanPalauPanamaPapua New GuineaParaguayPeruPhilippinesPolandPortugalPost-demographic dividendPre-demographic dividendPuerto RicoQatarRomaniaRussian FederationRwandaSamoaSao Tome and PrincipeSaudi ArabiaSenegalSerbiaSeychellesSierra LeoneSingaporeSlovak RepublicSloveniaSmall statesSolomon IslandsSouth AfricaSouth AsiaSouth Asia (IDA & IBRD)SpainSri LankaSt. Kitts and NevisSt. LuciaSt. Vincent and the GrenadinesSub-Saharan Africa Sub-Saharan Africa (excluding high income)Sub-Saharan Africa (IDA & IBRD countries)SudanSurinameSwazilandSwedenSwitzerlandSyrian Arab RepublicTajikistanTanzaniaThailandTimor-LesteTogoTongaTrinidad and TobagoTunisiaTurkeyTurkmenistanTuvaluUgandaUkraineUnited Arab EmiratesUnited KingdomUnited StatesUpper middle incomeUruguayUzbekistanVanuatuVenezuela, RBVietnamWest Bank and GazaWorldYemen, Rep.ZambiaZimbabwe línea de tiempo (timeline):
En esta escala de tiempo se presenta un gráfico de 1961 y 2016 de South Asia (IDA & IBRD). Los datos de 1960 están ausentes. El número de observaciones reales por fecha: 56.
Fuente (nombre):
Indicadores del desarrollo mundial
Fuente (organización):
World Bank national accounts data, and OECD National Accounts data files.
Categorías:
Economy & Growth
Se ha actualizado:
23 abr 2017 año
Los indicadores de los cambios de valor en los últimos años
Mínimo:
5.855 bn
1 ene 1961 año
Máximo:
393.804 bn
1 ene 2016 año
A la fecha de observación
Valor
Cambio absoluto
El cambio con respecto al valor anterior
1 ene 1961 año
5.855 bn
+5.855 bn
0.0%
1 ene 1962 año
6.453 bn
+597.799 millones
10.21%
1 ene 1963 año
7.151 bn
+698.131 millones
10.82%
1 ene 1964 año
8.068 bn
+916.811 millones
12.82%
1 ene 1965 año
8.863 bn
+794.84 millones
9.85%
1 ene 1966 año
9.549 bn
+686.217 millones
7.74%
1 ene 1967 año
7.641 bn
-1.908 bn
-19.98%
1 ene 1968 año
7.728 bn
+87.572 millones
1.15%
1 ene 1969 año
8.394 bn
+665.322 millones
8.61%
1 ene 1970 año
9.642 bn
+1.248 bn
14.87%
1 ene 1971 año
10.586 bn
+944.021 millones
9.79%
1 ene 1972 año
11.676 bn
+1.09 bn
10.3%
1 ene 1973 año
11.865 bn
+188.724 millones
1.62%
1 ene 1974 año
13.791 bn
+1.926 bn
16.23%
1 ene 1975 año
17.923 bn
+4.132 bn
29.96%
1 ene 1976 año
18.106 bn
+183.42 millones
1.02%
1 ene 1977 año
18.868 bn
+761.926 millones
4.21%
1 ene 1978 año
21.851 bn
+2.983 bn
15.81%
1 ene 1979 año
25.642 bn
+3.791 bn
17.35%
1 ene 1980 año
29.792 bn
+4.15 bn
16.19%
1 ene 1981 año
34.932 bn
+5.14 bn
17.25%
1 ene 1982 año
36.656 bn
+1.724 bn
4.93%
1 ene 1983 año
37.207 bn
+550.556 millones
1.5%
1 ene 1984 año
40.242 bn
+3.036 bn
8.16%
1 ene 1985 año
40.367 bn
+124.408 millones
0.31%
1 ene 1986 año
43.075 bn
+2.709 bn
6.71%
1 ene 1987 año
45.33 bn
+2.255 bn
5.23%
1 ene 1988 año
50.266 bn
+4.936 bn
10.89%
1 ene 1989 año
53.626 bn
+3.359 bn
6.68%
1 ene 1990 año
56.004 bn
+2.378 bn
4.43%
1 ene 1991 año
59.763 bn
+3.759 bn
6.71%
1 ene 1992 año
50.922 bn
-8.842 bn
-14.79%
1 ene 1993 año
54.601 bn
+3.679 bn
7.23%
1 ene 1994 año
54.596 bn
-5.071 millones
-0.01%
1 ene 1995 año
64.67 bn
+10.074 bn
18.45%
1 ene 1996 año
75.194 bn
+10.524 bn
16.27%
1 ene 1997 año
81.053 bn
+5.859 bn
7.79%
1 ene 1998 año
81.037 bn
-15.956 millones
-0.02%
1 ene 1999 año
79.579 bn
-1.458 bn
-1.8%
1 ene 2000 año
82.553 bn
+2.974 bn
3.74%
1 ene 2001 año
88.382 bn
+5.828 bn
7.06%
1 ene 2002 año
88.426 bn
+44.618 millones
0.05%
1 ene 2003 año
94.785 bn
+6.358 bn
7.19%
1 ene 2004 año
110.9 bn
+16.115 bn
17.0%
1 ene 2005 año
131.414 bn
+20.515 bn
18.5%
1 ene 2006 año
153.751 bn
+22.337 bn
17.0%
1 ene 2007 año
176.47 bn
+22.719 bn
14.78%
1 ene 2008 año
249.122 bn
+72.652 bn
41.17%
1 ene 2009 año
253.07 bn
+3.947 bn
1.58%
1 ene 2010 año
270.271 bn
+17.202 bn
6.8%
1 ene 2011 año
323.675 bn
+53.404 bn
19.76%
1 ene 2012 año
360.208 bn
+36.533 bn
11.29%
1 ene 2013 año
359.173 bn
-1.035 bn
-0.29%
1 ene 2014 año
356.54 bn
-2.632 bn
-0.73%
1 ene 2015 año
381.56 bn
+25.019 bn
7.02%
1 ene 2016 año
393.804 bn
+12.244 bn
3.21%
Ranking de los países por los datos estadísticos actuales


Comentarios: