29
/es/
es
AIzaSyAYiBZKx7MnpbEhh9jyipgxe19OcubqV5w
April 1, 2024
106224
China
CHN
true
2
1
Manufacturing, value added (current US$)
2014,2013,2012,2011,2010,2009,2008,2007,2006,2005,2004,2003,2002,2001,2000,1999,1998,1997,1996,1995,1994,1993,1992,1991,1990,1989,1988,1987,1986,1985,1984,1983,1982,1981,1980,1979,1978,1977,1976,1975,1974,1973,1972,1971,1970,1969,1968,1967
Estas estadísticas en otros países:
AfghanistanAlbaniaAlgeriaAndorraAngolaAntigua and BarbudaArab WorldArgentinaArmeniaArubaAustraliaAustriaAzerbaijanBahamas, TheBahrainBangladeshBarbadosBelarusBelgiumBelizeBeninBermudaBhutanBoliviaBosnia and HerzegovinaBotswanaBrazilBrunei DarussalamBurkina FasoBurundiCabo VerdeCambodiaCameroonCanadaCaribbean small statesCayman IslandsCentral African RepublicCentral Europe and the BalticsChadChileChinaColombiaComorosCongo, Dem. Rep.Congo, Rep.Costa RicaCote d'IvoireCroatiaCubaCyprusCzech RepublicDenmarkDjiboutiDominicaDominican RepublicEarly-demographic dividendEast Asia & PacificEast Asia & Pacific (excluding high income)East Asia & Pacific (IDA & IBRD countries)EcuadorEgypt, Arab Rep.El SalvadorEquatorial GuineaEritreaEstoniaEthiopiaEuro areaEurope & Central AsiaEurope & Central Asia (excluding high income)Europe & Central Asia (IDA & IBRD countries)European UnionFaroe IslandsFijiFinlandFragile and conflict affected situationsFranceGabonGambia, TheGeorgiaGermanyGhanaGreeceGrenadaGuatemalaGuineaGuinea-BissauGuyanaHeavily indebted poor countries (HIPC)High incomeHondurasHong Kong SAR, ChinaHungaryIBRD onlyIcelandIDA & IBRD totalIDA blendIDA onlyIDA totalIndiaIndonesiaIran, Islamic Rep.IraqIrelandItalyJamaicaJapanJordanKazakhstanKenyaKiribatiKorea, Rep.KosovoKuwaitKyrgyz RepublicLao PDRLate-demographic dividendLatin America & Caribbean Latin America & Caribbean (excluding high income)Latin America & the Caribbean (IDA & IBRD countries)LatviaLeast developed countries: UN classificationLebanonLesothoLiberiaLibyaLithuaniaLow & middle incomeLow incomeLower middle incomeLuxembourgMacao SAR, ChinaMacedonia, FYRMadagascarMalawiMalaysiaMaldivesMaliMaltaMarshall IslandsMauritaniaMauritiusMexicoMicronesia, Fed. Sts.Middle East & North AfricaMiddle East & North Africa (excluding high income)Middle East & North Africa (IDA & IBRD countries)Middle incomeMoldovaMongoliaMontenegroMoroccoMozambiqueMyanmarNamibiaNepalNetherlandsNew CaledoniaNew ZealandNicaraguaNigerNigeriaNorth AmericaNorwayOECD membersOmanOther small statesPacific island small statesPakistanPalauPanamaPapua New GuineaParaguayPeruPhilippinesPolandPortugalPost-demographic dividendPre-demographic dividendPuerto RicoQatarRomaniaRussian FederationRwandaSamoaSao Tome and PrincipeSaudi ArabiaSenegalSerbiaSeychellesSierra LeoneSingaporeSlovak RepublicSloveniaSmall statesSolomon IslandsSouth AfricaSouth AsiaSouth Asia (IDA & IBRD)SpainSri LankaSt. Kitts and NevisSt. LuciaSt. Vincent and the GrenadinesSub-Saharan Africa Sub-Saharan Africa (excluding high income)Sub-Saharan Africa (IDA & IBRD countries)SudanSurinameSwazilandSwedenSwitzerlandSyrian Arab RepublicTajikistanTanzaniaThailandTimor-LesteTogoTongaTrinidad and TobagoTunisiaTurkeyTurkmenistanTuvaluUgandaUkraineUnited Arab EmiratesUnited KingdomUnited StatesUpper middle incomeUruguayUzbekistanVanuatuVenezuela, RBVietnamWest Bank and GazaWorldYemen, Rep.ZambiaZimbabwe línea de tiempo (timeline):
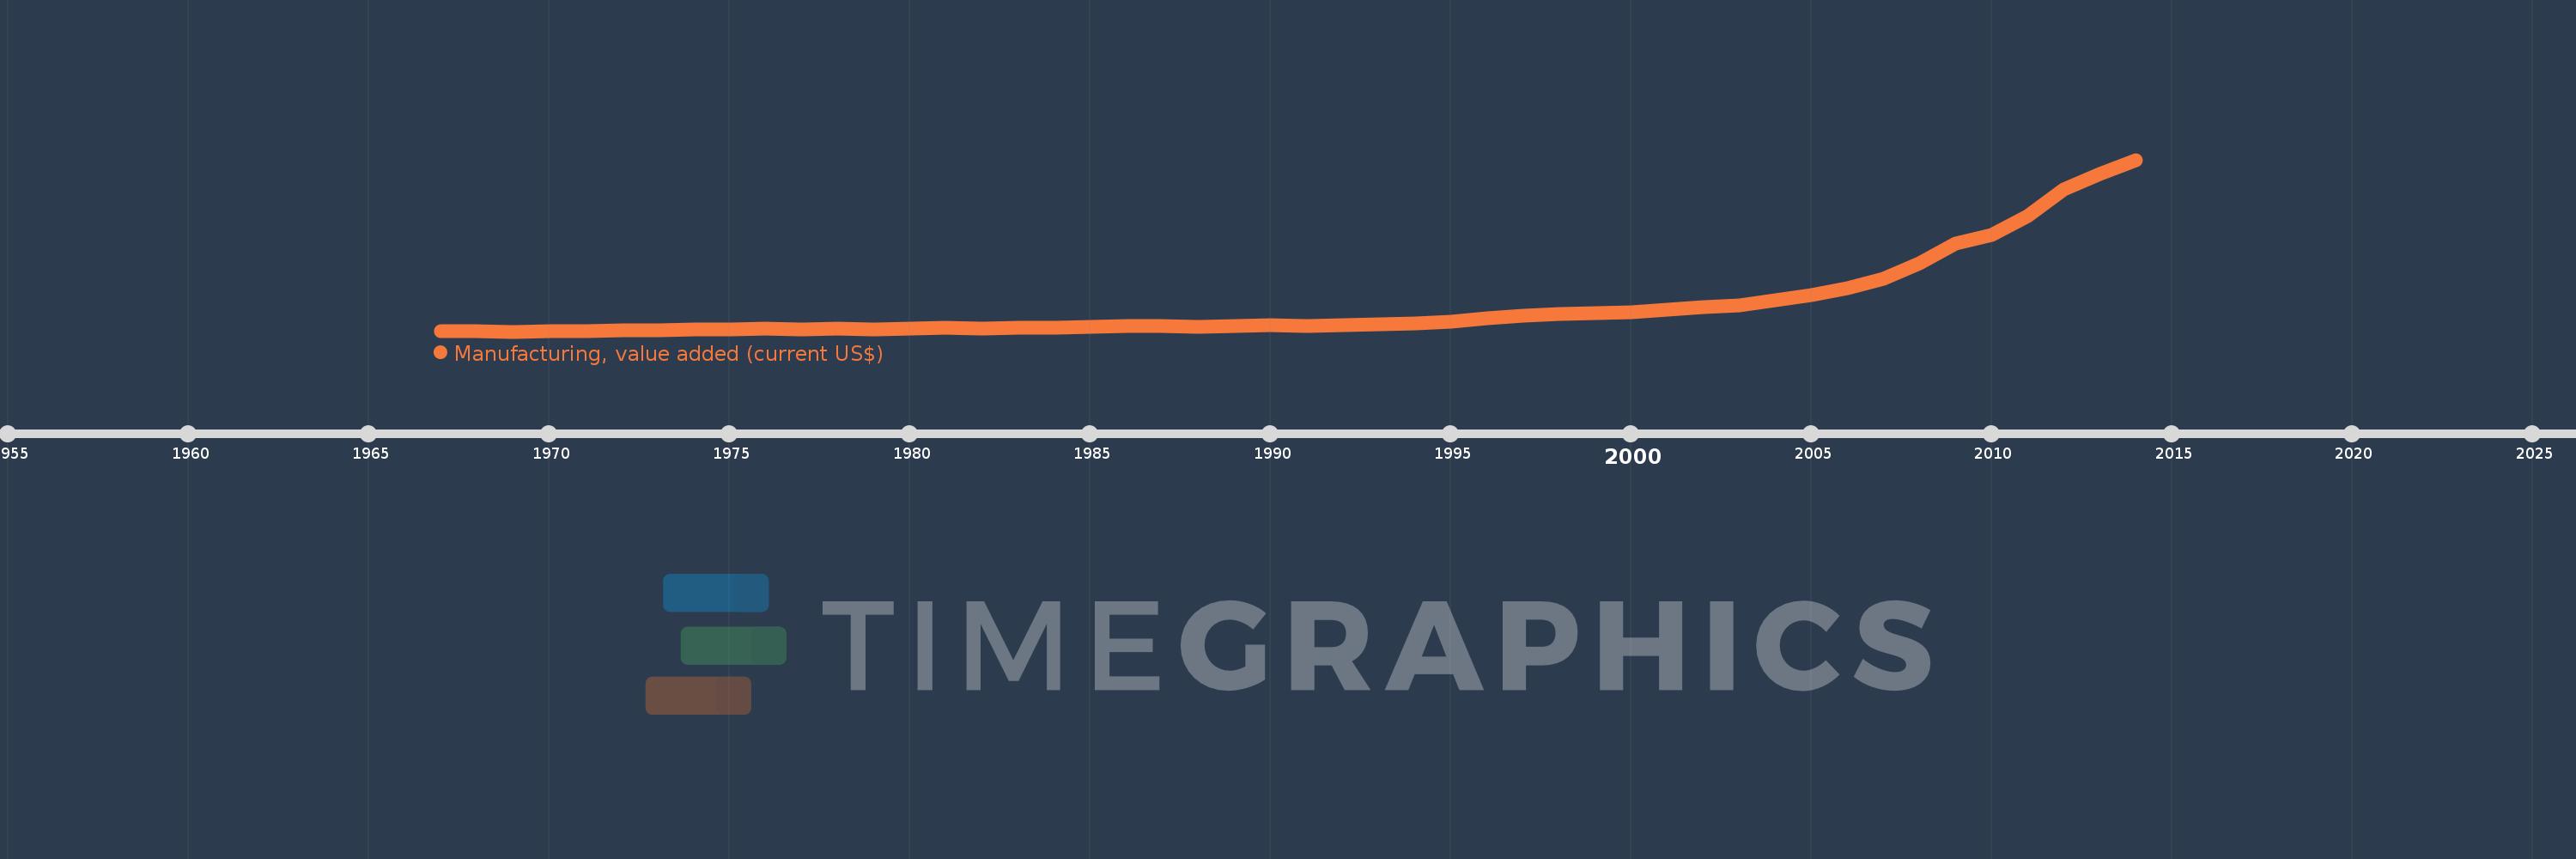
En esta escala de tiempo se presenta un gráfico de 1967 y 2014 de China. Los datos de 1966 están ausentes. El número de observaciones reales por fecha: 48.
Fuente (nombre):
Indicadores del desarrollo mundial
Fuente (organización):
World Bank national accounts data, and OECD National Accounts data files.
Categorías:
Economy & Growth
Se ha actualizado:
23 abr 2017 año
Los indicadores de los cambios de valor en los últimos años
Mínimo:
18.283 bn
1 ene 1969 año
Máximo:
2.857 billones
1 ene 2014 año
A la fecha de observación
Valor
Cambio absoluto
El cambio con respecto al valor anterior
1 ene 1967 año
24.186 bn
+24.186 bn
0.0%
1 ene 1968 año
20.319 bn
-3.867 bn
-15.99%
1 ene 1969 año
18.283 bn
-2.036 bn
-10.02%
1 ene 1970 año
23.347 bn
+5.064 bn
27.7%
1 ene 1971 año
30.88 bn
+7.533 bn
32.26%
1 ene 1972 año
34.553 bn
+3.673 bn
11.89%
1 ene 1973 año
40.476 bn
+5.923 bn
17.14%
1 ene 1974 año
49.49 bn
+9.014 bn
22.27%
1 ene 1975 año
50.721 bn
+1.231 bn
2.49%
1 ene 1976 año
61.448 bn
+10.727 bn
21.15%
1 ene 1977 año
56.96 bn
-4.488 bn
-7.3%
1 ene 1978 año
67.815 bn
+10.855 bn
19.06%
1 ene 1979 año
59.969 bn
-7.846 bn
-11.57%
1 ene 1980 año
70.634 bn
+10.666 bn
17.79%
1 ene 1981 año
76.2 bn
+5.566 bn
7.88%
1 ene 1982 año
74.376 bn
-1.823 bn
-2.39%
1 ene 1983 año
75.433 bn
+1.056 bn
1.42%
1 ene 1984 año
83.1 bn
+7.668 bn
10.16%
1 ene 1985 año
90.842 bn
+7.741 bn
9.32%
1 ene 1986 año
106.511 bn
+15.669 bn
17.25%
1 ene 1987 año
104.177 bn
-2.334 bn
-2.19%
1 ene 1988 año
93.155 bn
-11.021 bn
-10.58%
1 ene 1989 año
107.104 bn
+13.949 bn
14.97%
1 ene 1990 año
117.998 bn
+10.894 bn
10.17%
1 ene 1991 año
116.573 bn
-1.425 bn
-1.21%
1 ene 1992 año
123.279 bn
+6.706 bn
5.75%
1 ene 1993 año
138.364 bn
+15.086 bn
12.24%
1 ene 1994 año
149.639 bn
+11.274 bn
8.15%
1 ene 1995 año
188.056 bn
+38.418 bn
25.67%
1 ene 1996 año
245.004 bn
+56.947 bn
30.28%
1 ene 1997 año
286.889 bn
+41.885 bn
17.1%
1 ene 1998 año
316.117 bn
+29.229 bn
10.19%
1 ene 1999 año
324.608 bn
+8.491 bn
2.69%
1 ene 2000 año
342.226 bn
+17.617 bn
5.43%
1 ene 2001 año
384.937 bn
+42.712 bn
12.48%
1 ene 2002 año
419.112 bn
+34.174 bn
8.88%
1 ene 2003 año
456.719 bn
+37.608 bn
8.97%
1 ene 2004 año
539.034 bn
+82.314 bn
18.02%
1 ene 2005 año
625.224 bn
+86.19 bn
15.99%
1 ene 2006 año
733.656 bn
+108.433 bn
17.34%
1 ene 2007 año
893.131 bn
+159.475 bn
21.74%
1 ene 2008 año
1.15 billones
+256.589 bn
28.73%
1 ene 2009 año
1.476 billones
+325.944 bn
28.35%
1 ene 2010 año
1.612 billones
+136.282 bn
9.24%
1 ene 2011 año
1.924 billones
+312.378 bn
19.38%
1 ene 2012 año
2.369 billones
+444.517 bn
23.1%
1 ene 2013 año
2.624 billones
+255.444 bn
10.78%
1 ene 2014 año
2.857 billones
+232.696 bn
8.87%
Ranking de los países por los datos estadísticos actuales


Comentarios: