29
/es/
es
AIzaSyAYiBZKx7MnpbEhh9jyipgxe19OcubqV5w
April 1, 2024
57580
South Asia
SAS
false
2
1
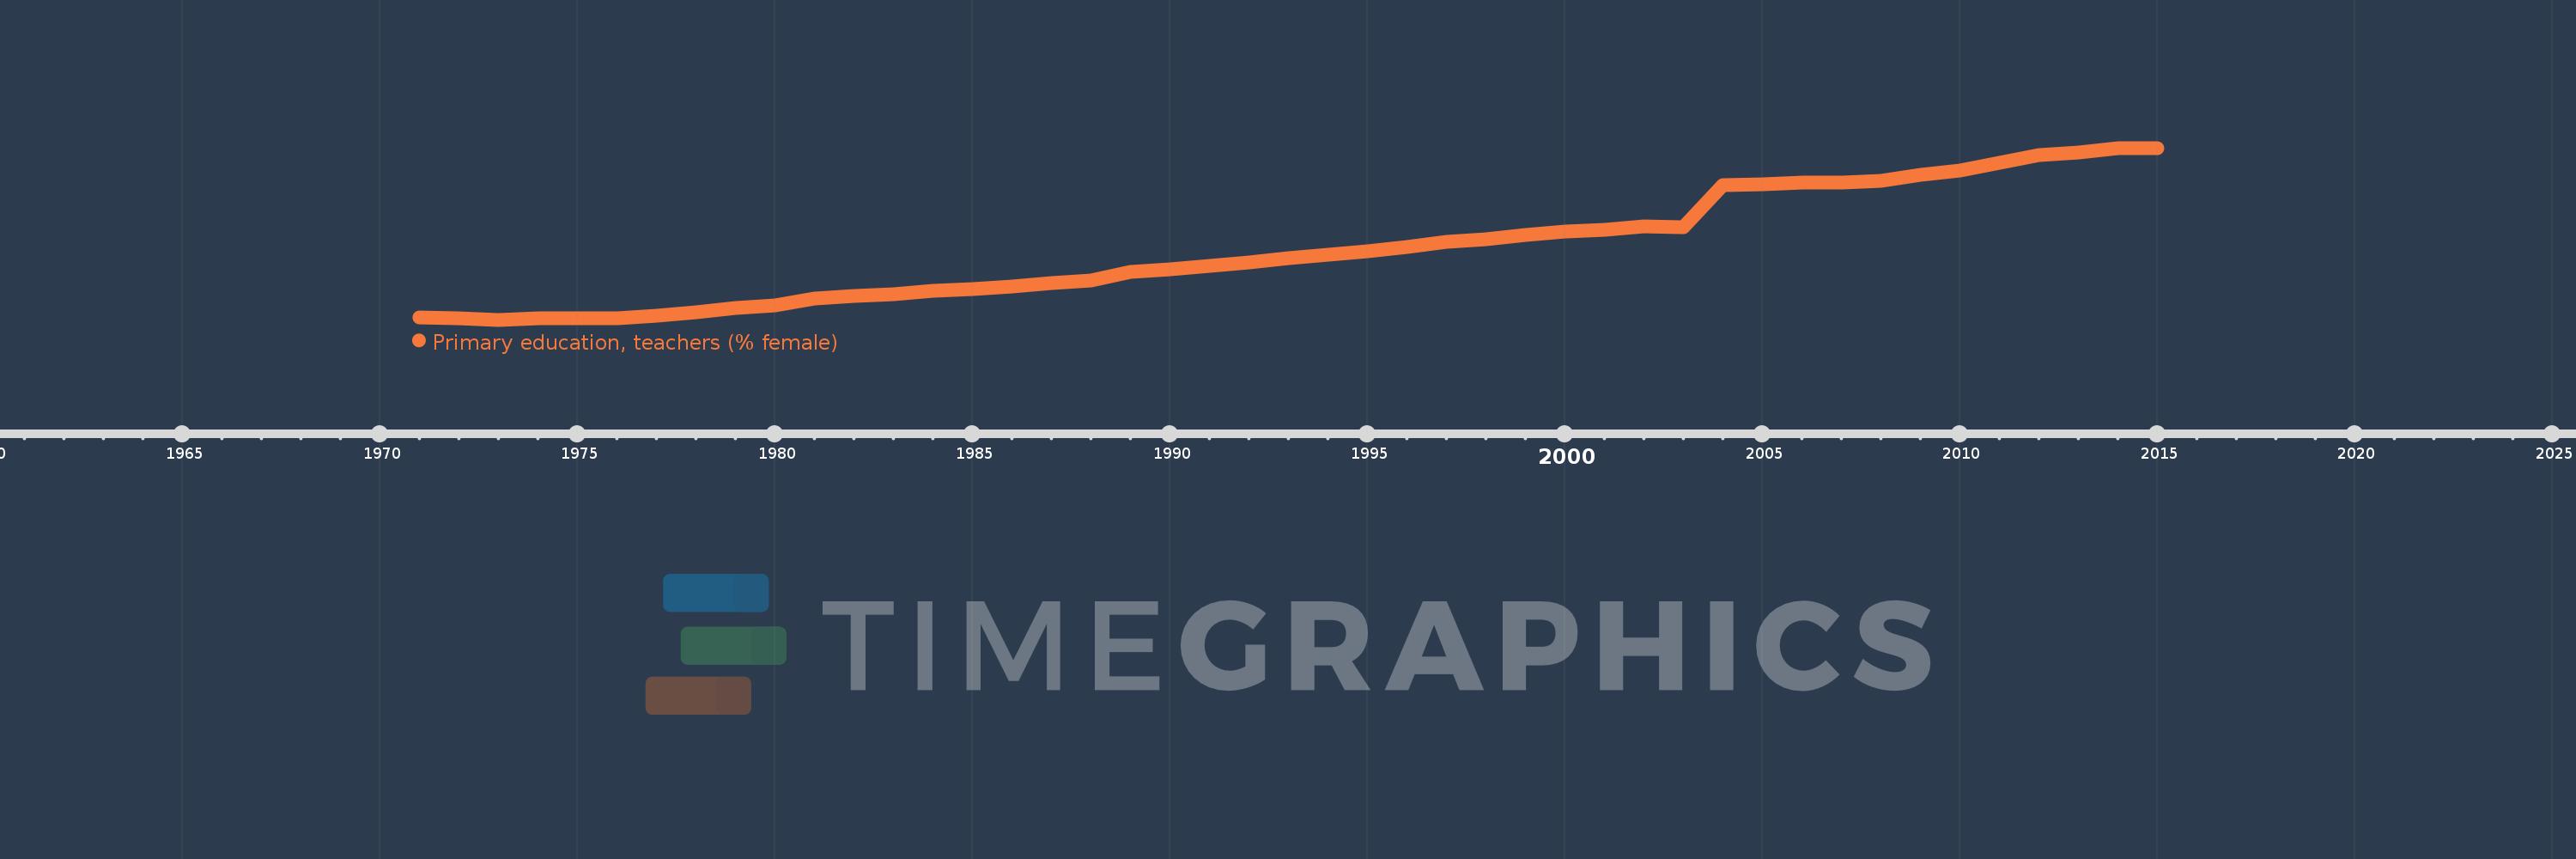
Primary education, teachers (% female)
2015,2014,2013,2012,2011,2010,2009,2008,2007,2006,2005,2004,2003,2002,2001,2000,1999,1998,1997,1996,1995,1994,1993,1992,1991,1990,1989,1988,1987,1986,1985,1984,1983,1982,1981,1980,1979,1978,1977,1976,1975,1974,1973,1972,1971
Estas estadísticas en otros países:
AfghanistanAlbaniaAlgeriaAndorraAngolaAntigua and BarbudaArab WorldArgentinaArmeniaArubaAustraliaAustriaAzerbaijanBahamas, TheBahrainBangladeshBarbadosBelarusBelgiumBelizeBeninBermudaBhutanBoliviaBosnia and HerzegovinaBotswanaBrazilBritish Virgin IslandsBrunei DarussalamBulgariaBurkina FasoBurundiCabo VerdeCambodiaCameroonCanadaCaribbean small statesCayman IslandsCentral African RepublicCentral Europe and the BalticsChadChileChinaColombiaComorosCongo, Dem. Rep.Congo, Rep.Costa RicaCote d'IvoireCroatiaCubaCyprusCzech RepublicDenmarkDjiboutiDominicaDominican RepublicEarly-demographic dividendEast Asia & PacificEast Asia & Pacific (excluding high income)East Asia & Pacific (IDA & IBRD countries)EcuadorEgypt, Arab Rep.El SalvadorEquatorial GuineaEritreaEstoniaEthiopiaEuro areaEurope & Central AsiaEurope & Central Asia (excluding high income)Europe & Central Asia (IDA & IBRD countries)European UnionFijiFinlandFragile and conflict affected situationsFranceGabonGambia, TheGeorgiaGermanyGhanaGibraltarGreeceGrenadaGuatemalaGuineaGuinea-BissauGuyanaHaitiHeavily indebted poor countries (HIPC)High incomeHondurasHong Kong SAR, ChinaHungaryIBRD onlyIcelandIDA & IBRD totalIDA blendIDA onlyIDA totalIndiaIndonesiaIran, Islamic Rep.IraqIrelandIsraelItalyJamaicaJapanJordanKazakhstanKenyaKiribatiKorea, Dem. People’s Rep.Korea, Rep.KuwaitKyrgyz RepublicLao PDRLate-demographic dividendLatin America & Caribbean Latin America & Caribbean (excluding high income)Latin America & the Caribbean (IDA & IBRD countries)LatviaLeast developed countries: UN classificationLebanonLesothoLiberiaLibyaLiechtensteinLithuaniaLow & middle incomeLow incomeLower middle incomeLuxembourgMacao SAR, ChinaMacedonia, FYRMadagascarMalawiMalaysiaMaldivesMaliMaltaMarshall IslandsMauritaniaMauritiusMexicoMiddle East & North AfricaMiddle East & North Africa (excluding high income)Middle East & North Africa (IDA & IBRD countries)Middle incomeMoldovaMonacoMongoliaMoroccoMozambiqueMyanmarNamibiaNauruNepalNetherlandsNew ZealandNicaraguaNigerNigeriaNorth AmericaNorwayOECD membersOmanOther small statesPacific island small statesPakistanPalauPanamaPapua New GuineaParaguayPeruPhilippinesPolandPortugalPost-demographic dividendPre-demographic dividendPuerto RicoQatarRomaniaRussian FederationRwandaSamoaSan MarinoSao Tome and PrincipeSaudi ArabiaSenegalSerbiaSeychellesSierra LeoneSingaporeSint Maarten (Dutch part)Slovak RepublicSloveniaSmall statesSolomon IslandsSomaliaSouth AfricaSouth AsiaSouth Asia (IDA & IBRD)South SudanSpainSri LankaSt. Kitts and NevisSt. LuciaSt. Vincent and the GrenadinesSub-Saharan Africa Sub-Saharan Africa (excluding high income)Sub-Saharan Africa (IDA & IBRD countries)SudanSurinameSwazilandSwedenSwitzerlandSyrian Arab RepublicTajikistanTanzaniaThailandTimor-LesteTogoTongaTrinidad and TobagoTunisiaTurkeyTurks and Caicos IslandsTuvaluUgandaUkraineUnited Arab EmiratesUnited KingdomUnited StatesUpper middle incomeUruguayUzbekistanVanuatuVenezuela, RBVietnamWest Bank and GazaWorldYemen, Rep.ZambiaZimbabwe línea de tiempo (timeline):
En esta escala de tiempo se presenta un gráfico de 1971 y 2015 de South Asia. Los datos de 1970 están ausentes. El número de observaciones reales por fecha: 45.
Fuente (nombre):
Indicadores del desarrollo mundial
Fuente (organización):
United Nations Educational, Scientific, and Cultural Organization (UNESCO) Institute for Statistics.
Categorías:
Education, Gender
Se ha actualizado:
23 abr 2017 año
Los indicadores de los cambios de valor en los últimos años
Mínimo:
23.695
1 ene 1973 año
Máximo:
48.621
1 ene 2015 año
A la fecha de observación
Valor
Cambio absoluto
El cambio con respecto al valor anterior
1 ene 1971 año
24.011
+24.011
0.0%
1 ene 1972 año
23.934
-0.077
-0.32%
1 ene 1973 año
23.695
-0.238
-1.0%
1 ene 1974 año
23.925
+0.23
0.97%
1 ene 1975 año
23.932
+0.007
0.03%
1 ene 1976 año
23.845
-0.087
-0.36%
1 ene 1977 año
24.315
+0.47
1.97%
1 ene 1978 año
24.831
+0.516
2.12%
1 ene 1979 año
25.442
+0.611
2.46%
1 ene 1980 año
25.752
+0.31
1.22%
1 ene 1981 año
26.763
+1.011
3.92%
1 ene 1982 año
27.191
+0.428
1.6%
1 ene 1983 año
27.449
+0.258
0.95%
1 ene 1984 año
27.839
+0.391
1.42%
1 ene 1985 año
28.109
+0.27
0.97%
1 ene 1986 año
28.557
+0.448
1.59%
1 ene 1987 año
29.033
+0.476
1.67%
1 ene 1988 año
29.41
+0.376
1.3%
1 ene 1989 año
30.577
+1.168
3.97%
1 ene 1990 año
31.046
+0.469
1.53%
1 ene 1991 año
31.54
+0.494
1.59%
1 ene 1992 año
32.06
+0.52
1.65%
1 ene 1993 año
32.579
+0.519
1.62%
1 ene 1994 año
33.097
+0.517
1.59%
1 ene 1995 año
33.685
+0.588
1.78%
1 ene 1996 año
34.254
+0.569
1.69%
1 ene 1997 año
34.94
+0.687
2.01%
1 ene 1998 año
35.424
+0.483
1.38%
1 ene 1999 año
35.935
+0.512
1.44%
1 ene 2000 año
36.499
+0.563
1.57%
1 ene 2001 año
36.783
+0.284
0.78%
1 ene 2002 año
37.183
+0.4
1.09%
1 ene 2003 año
37.122
-0.062
-0.17%
1 ene 2004 año
43.185
+6.064
16.33%
1 ene 2005 año
43.305
+0.119
0.28%
1 ene 2006 año
43.545
+0.24
0.55%
1 ene 2007 año
43.547
+0.003
0.01%
1 ene 2008 año
43.84
+0.292
0.67%
1 ene 2009 año
44.715
+0.875
2.0%
1 ene 2010 año
45.355
+0.64
1.43%
1 ene 2011 año
46.51
+1.155
2.55%
1 ene 2012 año
47.572
+1.062
2.28%
1 ene 2013 año
47.969
+0.397
0.84%
1 ene 2014 año
48.558
+0.589
1.23%
1 ene 2015 año
48.621
+0.062
0.13%
Ranking de los países por los datos estadísticos actuales


Comentarios: