29
/es/
es
AIzaSyAYiBZKx7MnpbEhh9jyipgxe19OcubqV5w
April 1, 2024
27648
East Asia & Pacific
EAS
false
2
1
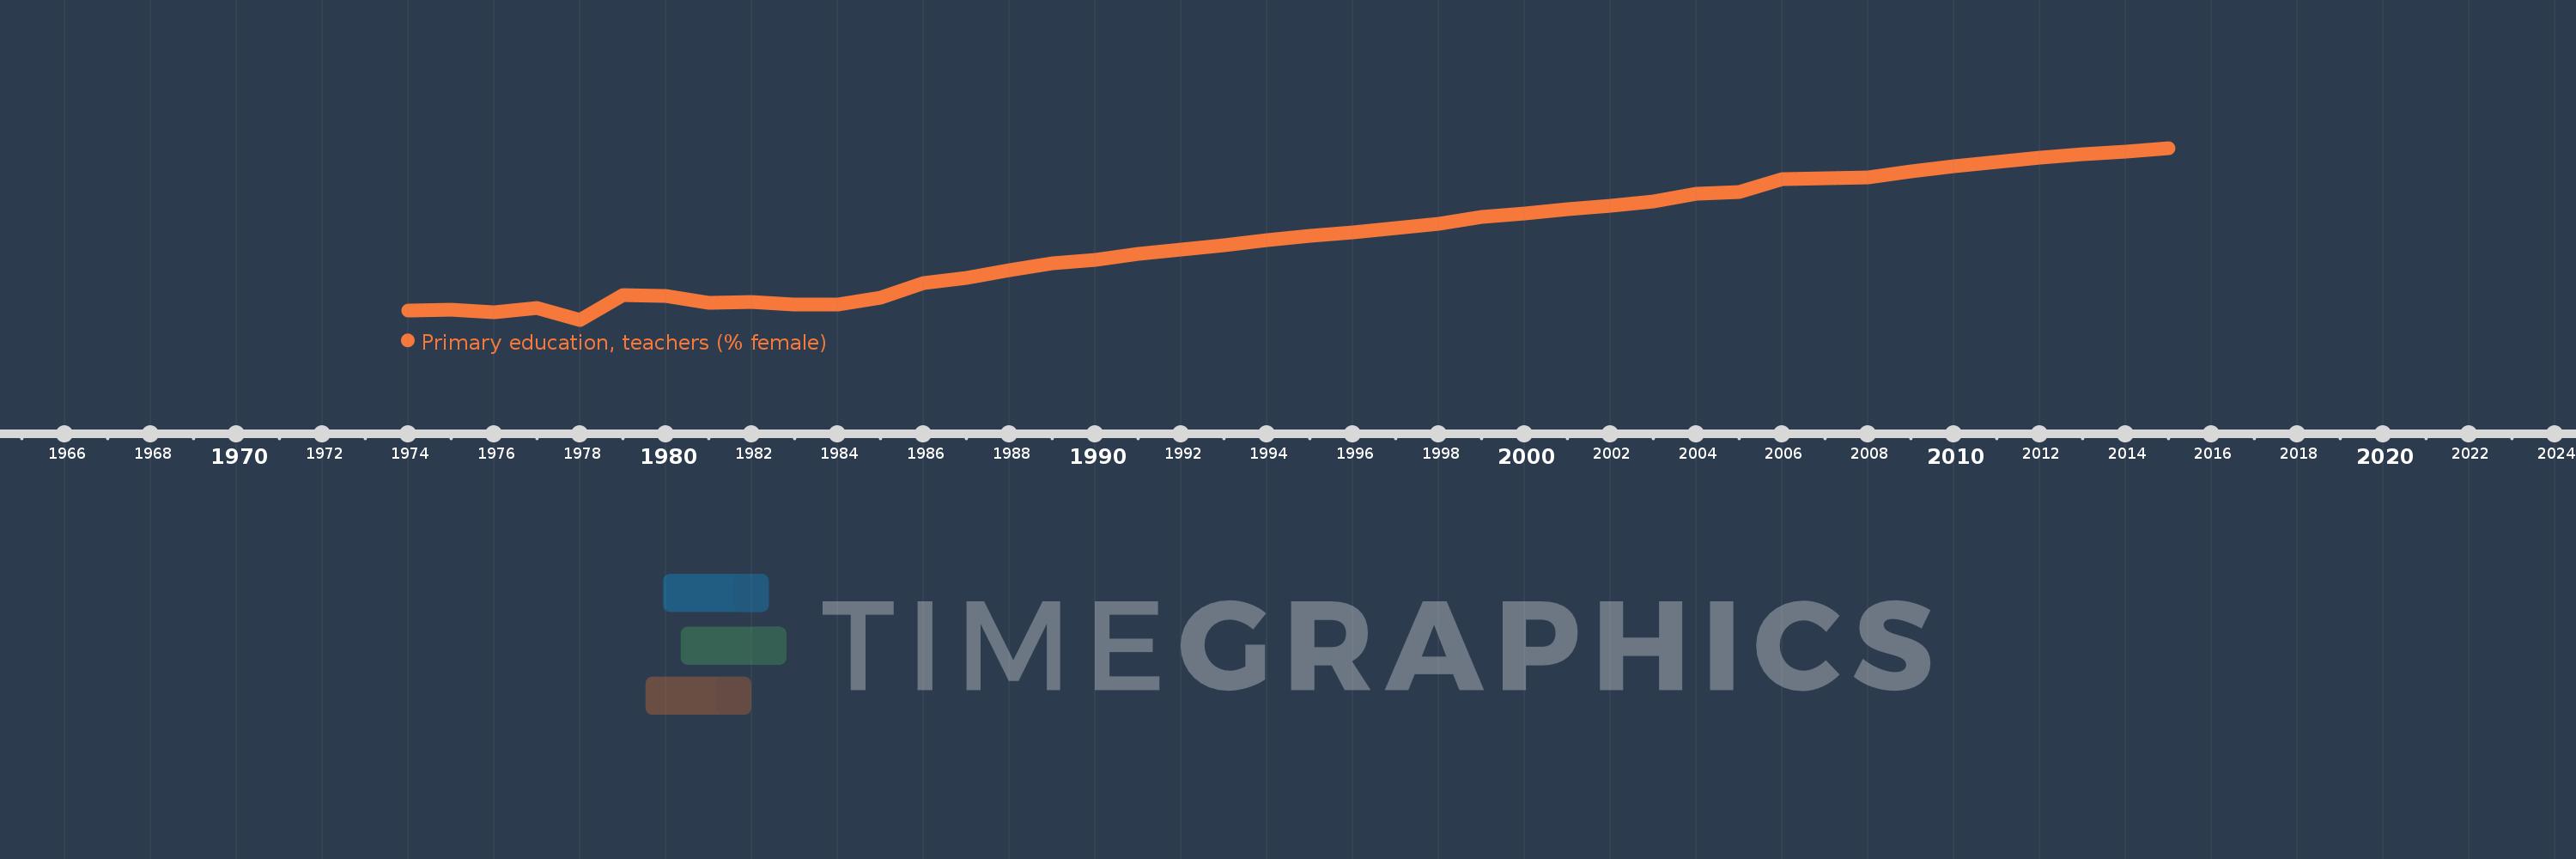
Primary education, teachers (% female)
2015,2014,2013,2012,2011,2010,2009,2008,2007,2006,2005,2004,2003,2002,2001,2000,1999,1998,1997,1996,1995,1994,1993,1992,1991,1990,1989,1988,1987,1986,1985,1984,1983,1982,1981,1980,1979,1978,1977,1976,1975,1974
Estas estadísticas en otros países:
AfghanistanAlbaniaAlgeriaAndorraAngolaAntigua and BarbudaArab WorldArgentinaArmeniaArubaAustraliaAustriaAzerbaijanBahamas, TheBahrainBangladeshBarbadosBelarusBelgiumBelizeBeninBermudaBhutanBoliviaBosnia and HerzegovinaBotswanaBrazilBritish Virgin IslandsBrunei DarussalamBulgariaBurkina FasoBurundiCabo VerdeCambodiaCameroonCanadaCaribbean small statesCayman IslandsCentral African RepublicCentral Europe and the BalticsChadChileChinaColombiaComorosCongo, Dem. Rep.Congo, Rep.Costa RicaCote d'IvoireCroatiaCubaCyprusCzech RepublicDenmarkDjiboutiDominicaDominican RepublicEarly-demographic dividendEast Asia & PacificEast Asia & Pacific (excluding high income)East Asia & Pacific (IDA & IBRD countries)EcuadorEgypt, Arab Rep.El SalvadorEquatorial GuineaEritreaEstoniaEthiopiaEuro areaEurope & Central AsiaEurope & Central Asia (excluding high income)Europe & Central Asia (IDA & IBRD countries)European UnionFijiFinlandFragile and conflict affected situationsFranceGabonGambia, TheGeorgiaGermanyGhanaGibraltarGreeceGrenadaGuatemalaGuineaGuinea-BissauGuyanaHaitiHeavily indebted poor countries (HIPC)High incomeHondurasHong Kong SAR, ChinaHungaryIBRD onlyIcelandIDA & IBRD totalIDA blendIDA onlyIDA totalIndiaIndonesiaIran, Islamic Rep.IraqIrelandIsraelItalyJamaicaJapanJordanKazakhstanKenyaKiribatiKorea, Dem. People’s Rep.Korea, Rep.KuwaitKyrgyz RepublicLao PDRLate-demographic dividendLatin America & Caribbean Latin America & Caribbean (excluding high income)Latin America & the Caribbean (IDA & IBRD countries)LatviaLeast developed countries: UN classificationLebanonLesothoLiberiaLibyaLiechtensteinLithuaniaLow & middle incomeLow incomeLower middle incomeLuxembourgMacao SAR, ChinaMacedonia, FYRMadagascarMalawiMalaysiaMaldivesMaliMaltaMarshall IslandsMauritaniaMauritiusMexicoMiddle East & North AfricaMiddle East & North Africa (excluding high income)Middle East & North Africa (IDA & IBRD countries)Middle incomeMoldovaMonacoMongoliaMoroccoMozambiqueMyanmarNamibiaNauruNepalNetherlandsNew ZealandNicaraguaNigerNigeriaNorth AmericaNorwayOECD membersOmanOther small statesPacific island small statesPakistanPalauPanamaPapua New GuineaParaguayPeruPhilippinesPolandPortugalPost-demographic dividendPre-demographic dividendPuerto RicoQatarRomaniaRussian FederationRwandaSamoaSan MarinoSao Tome and PrincipeSaudi ArabiaSenegalSerbiaSeychellesSierra LeoneSingaporeSint Maarten (Dutch part)Slovak RepublicSloveniaSmall statesSolomon IslandsSomaliaSouth AfricaSouth AsiaSouth Asia (IDA & IBRD)South SudanSpainSri LankaSt. Kitts and NevisSt. LuciaSt. Vincent and the GrenadinesSub-Saharan Africa Sub-Saharan Africa (excluding high income)Sub-Saharan Africa (IDA & IBRD countries)SudanSurinameSwazilandSwedenSwitzerlandSyrian Arab RepublicTajikistanTanzaniaThailandTimor-LesteTogoTongaTrinidad and TobagoTunisiaTurkeyTurks and Caicos IslandsTuvaluUgandaUkraineUnited Arab EmiratesUnited KingdomUnited StatesUpper middle incomeUruguayUzbekistanVanuatuVenezuela, RBVietnamWest Bank and GazaWorldYemen, Rep.ZambiaZimbabwe línea de tiempo (timeline):
En esta escala de tiempo se presenta un gráfico de 1974 y 2015 de East Asia & Pacific. Los datos de 1973 están ausentes. El número de observaciones reales por fecha: 42.
Fuente (nombre):
Indicadores del desarrollo mundial
Fuente (organización):
United Nations Educational, Scientific, and Cultural Organization (UNESCO) Institute for Statistics.
Categorías:
Education, Gender
Se ha actualizado:
23 abr 2017 año
Los indicadores de los cambios de valor en los últimos años
Mínimo:
39.221
1 ene 1978 año
Máximo:
64.313
1 ene 2015 año
A la fecha de observación
Valor
Cambio absoluto
El cambio con respecto al valor anterior
1 ene 1974 año
40.622
+40.622
0.0%
1 ene 1975 año
40.633
+0.011
0.03%
1 ene 1976 año
40.324
-0.309
-0.76%
1 ene 1977 año
40.953
+0.629
1.56%
1 ene 1978 año
39.221
-1.732
-4.23%
1 ene 1979 año
42.801
+3.58
9.13%
1 ene 1980 año
42.653
-0.148
-0.35%
1 ene 1981 año
41.631
-1.022
-2.4%
1 ene 1982 año
41.785
+0.154
0.37%
1 ene 1983 año
41.382
-0.403
-0.96%
1 ene 1984 año
41.425
+0.043
0.1%
1 ene 1985 año
42.428
+1.003
2.42%
1 ene 1986 año
44.552
+2.124
5.01%
1 ene 1987 año
45.372
+0.82
1.84%
1 ene 1988 año
46.425
+1.054
2.32%
1 ene 1989 año
47.454
+1.029
2.22%
1 ene 1990 año
47.966
+0.511
1.08%
1 ene 1991 año
48.875
+0.909
1.9%
1 ene 1992 año
49.438
+0.563
1.15%
1 ene 1993 año
50.07
+0.632
1.28%
1 ene 1994 año
50.796
+0.726
1.45%
1 ene 1995 año
51.452
+0.656
1.29%
1 ene 1996 año
51.944
+0.492
0.96%
1 ene 1997 año
52.637
+0.693
1.33%
1 ene 1998 año
53.21
+0.573
1.09%
1 ene 1999 año
54.227
+1.017
1.91%
1 ene 2000 año
54.691
+0.464
0.86%
1 ene 2001 año
55.332
+0.641
1.17%
1 ene 2002 año
55.868
+0.536
0.97%
1 ene 2003 año
56.528
+0.66
1.18%
1 ene 2004 año
57.683
+1.155
2.04%
1 ene 2005 año
57.845
+0.162
0.28%
1 ene 2006 año
59.725
+1.88
3.25%
1 ene 2007 año
59.941
+0.216
0.36%
1 ene 2008 año
59.952
+0.011
0.02%
1 ene 2009 año
60.844
+0.892
1.49%
1 ene 2010 año
61.701
+0.857
1.41%
1 ene 2011 año
62.324
+0.623
1.01%
1 ene 2012 año
62.925
+0.601
0.96%
1 ene 2013 año
63.436
+0.511
0.81%
1 ene 2014 año
63.762
+0.327
0.52%
1 ene 2015 año
64.313
+0.55
0.86%
Ranking de los países por los datos estadísticos actuales


Comentarios: