29
/es/
es
AIzaSyAYiBZKx7MnpbEhh9jyipgxe19OcubqV5w
April 1, 2024
57447
South Asia
SAS
false
2
1
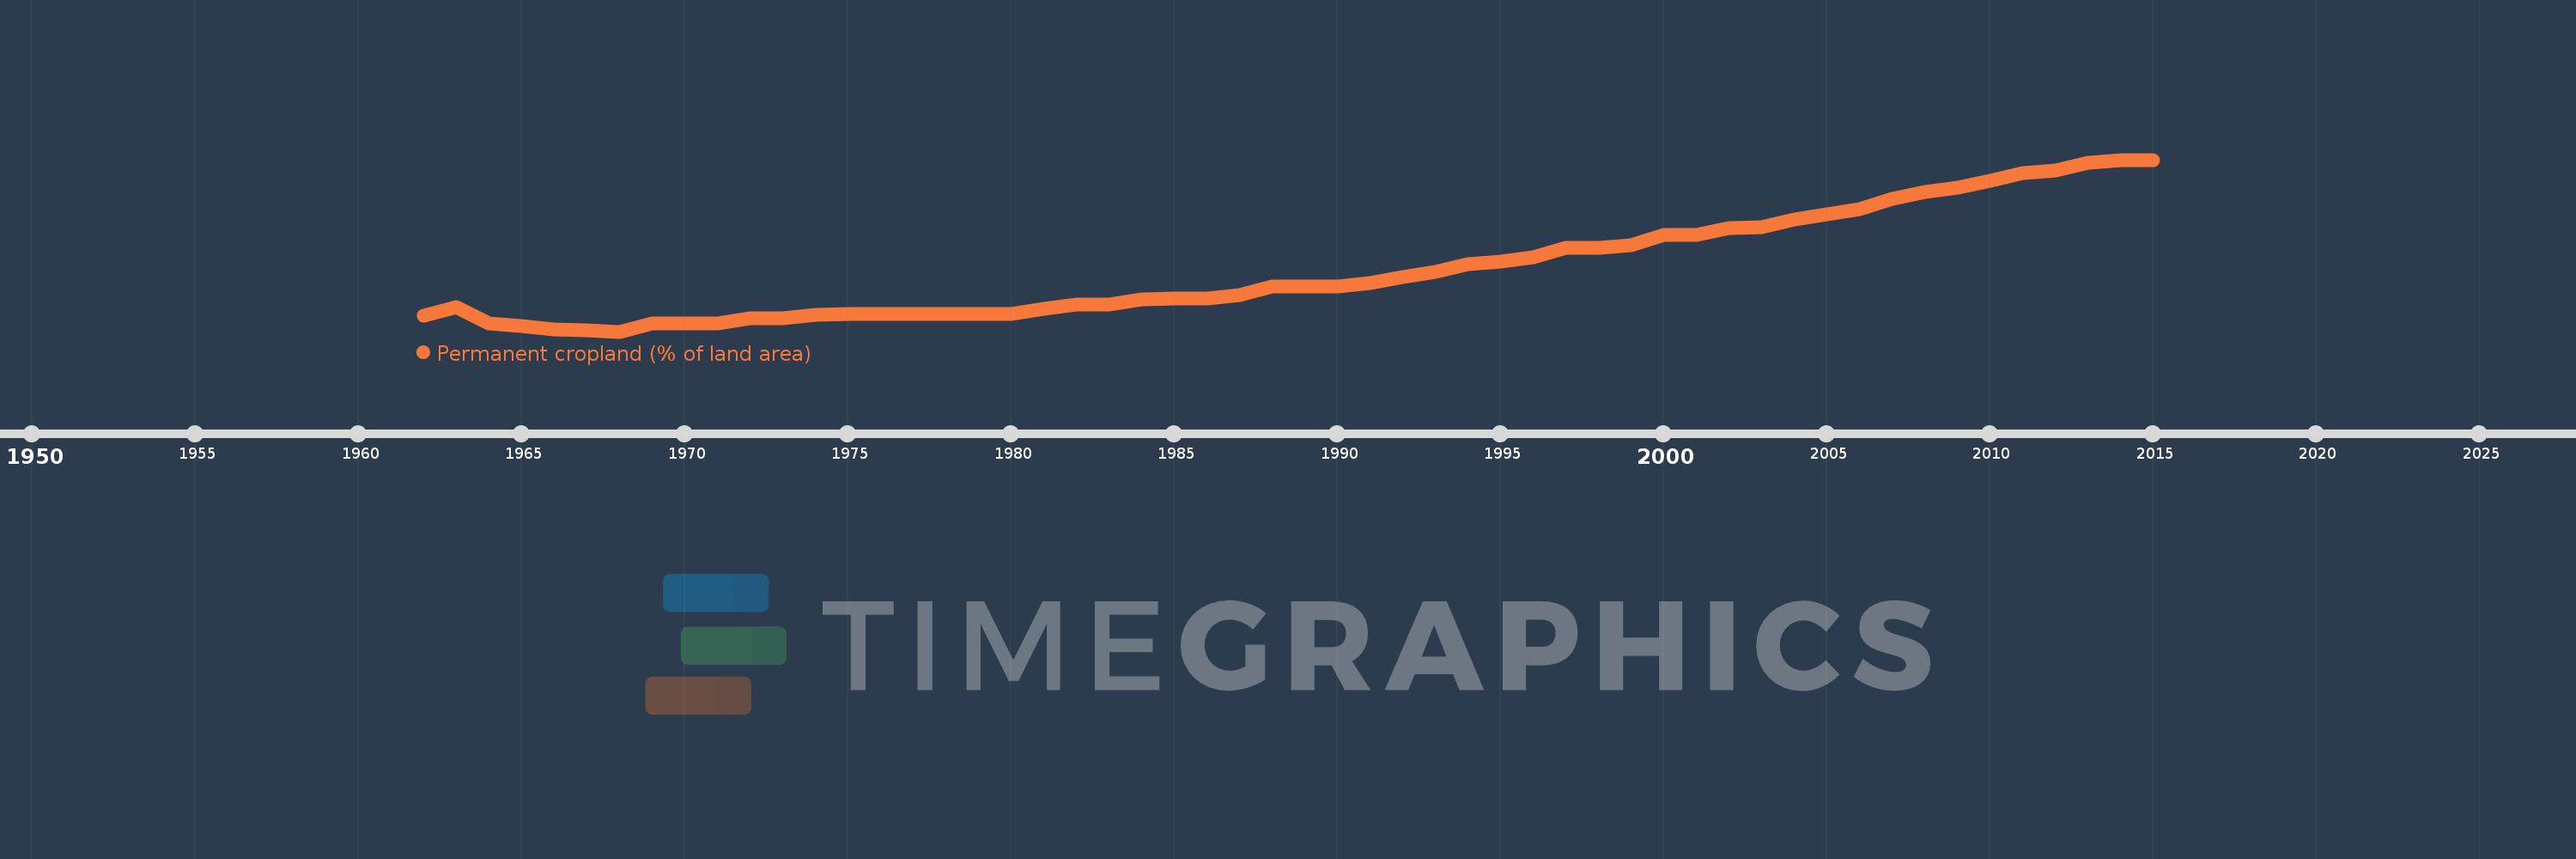
Permanent cropland (% of land area)
2015,2014,2013,2012,2011,2010,2009,2008,2007,2006,2005,2004,2003,2002,2001,2000,1999,1998,1997,1996,1995,1994,1993,1992,1991,1990,1989,1988,1987,1986,1985,1984,1983,1982,1981,1980,1979,1978,1977,1976,1975,1974,1973,1972,1971,1970,1969,1968,1967,1966,1965,1964,1963,1962
Estas estadísticas en otros países:
AfghanistanAlbaniaAlgeriaAmerican SamoaAngolaAntigua and BarbudaArab WorldArgentinaArmeniaAustraliaAustriaAzerbaijanBahamas, TheBahrainBangladeshBarbadosBelarusBelgiumBelizeBeninBhutanBoliviaBosnia and HerzegovinaBotswanaBrazilBritish Virgin IslandsBrunei DarussalamBulgariaBurkina FasoBurundiCabo VerdeCambodiaCameroonCanadaCaribbean small statesCayman IslandsCentral African RepublicCentral Europe and the BalticsChadChileChinaColombiaComorosCongo, Dem. Rep.Congo, Rep.Costa RicaCote d'IvoireCroatiaCubaCyprusCzech RepublicDenmarkDominicaDominican RepublicEarly-demographic dividendEast Asia & PacificEast Asia & Pacific (excluding high income)East Asia & Pacific (IDA & IBRD countries)EcuadorEgypt, Arab Rep.El SalvadorEquatorial GuineaEritreaEstoniaEthiopiaEuro areaEurope & Central AsiaEurope & Central Asia (excluding high income)Europe & Central Asia (IDA & IBRD countries)European UnionFijiFinlandFragile and conflict affected situationsFranceFrench PolynesiaGabonGambia, TheGeorgiaGermanyGhanaGreeceGrenadaGuamGuatemalaGuineaGuinea-BissauGuyanaHaitiHeavily indebted poor countries (HIPC)High incomeHondurasHong Kong SAR, ChinaHungaryIBRD onlyIDA & IBRD totalIDA blendIDA onlyIDA totalIndiaIndonesiaIran, Islamic Rep.IraqIrelandIsraelItalyJamaicaJapanJordanKazakhstanKenyaKiribatiKorea, Dem. People’s Rep.Korea, Rep.KuwaitKyrgyz RepublicLao PDRLate-demographic dividendLatin America & Caribbean Latin America & Caribbean (excluding high income)Latin America & the Caribbean (IDA & IBRD countries)LatviaLeast developed countries: UN classificationLebanonLesothoLiberiaLibyaLithuaniaLow & middle incomeLow incomeLower middle incomeLuxembourgMacedonia, FYRMadagascarMalawiMalaysiaMaldivesMaliMaltaMarshall IslandsMauritaniaMauritiusMexicoMicronesia, Fed. Sts.Middle East & North AfricaMiddle East & North Africa (excluding high income)Middle East & North Africa (IDA & IBRD countries)Middle incomeMoldovaMongoliaMontenegroMoroccoMozambiqueMyanmarNamibiaNauruNepalNetherlandsNew CaledoniaNew ZealandNicaraguaNigerNigeriaNorth AmericaNorthern Mariana IslandsNorwayOECD membersOmanOther small statesPacific island small statesPakistanPalauPanamaPapua New GuineaParaguayPeruPhilippinesPolandPortugalPost-demographic dividendPre-demographic dividendPuerto RicoQatarRomaniaRussian FederationRwandaSamoaSao Tome and PrincipeSaudi ArabiaSenegalSerbiaSeychellesSierra LeoneSingaporeSlovak RepublicSloveniaSmall statesSolomon IslandsSomaliaSouth AfricaSouth AsiaSouth Asia (IDA & IBRD)SpainSri LankaSt. Kitts and NevisSt. LuciaSt. Vincent and the GrenadinesSub-Saharan Africa Sub-Saharan Africa (excluding high income)Sub-Saharan Africa (IDA & IBRD countries)SudanSurinameSwazilandSwedenSwitzerlandSyrian Arab RepublicTajikistanTanzaniaThailandTimor-LesteTogoTongaTrinidad and TobagoTunisiaTurkeyTurkmenistanTuvaluUgandaUkraineUnited Arab EmiratesUnited KingdomUnited StatesUpper middle incomeUruguayUzbekistanVanuatuVenezuela, RBVietnamVirgin Islands (U.S.)West Bank and GazaWorldYemen, Rep.ZambiaZimbabwe línea de tiempo (timeline):
En esta escala de tiempo se presenta un gráfico de 1962 y 2015 de South Asia. Los datos de 1961 están ausentes. El número de observaciones reales por fecha: 54.
Fuente (nombre):
Indicadores del desarrollo mundial
Fuente (organización):
Food and Agriculture Organization, electronic files and web site.
Categorías:
Agriculture & Rural Development
Se ha actualizado:
23 abr 2017 año
Los indicadores de los cambios de valor en los últimos años
Mínimo:
1.189
1 ene 1968 año
Máximo:
3.355
1 ene 2015 año
A la fecha de observación
Valor
Cambio absoluto
El cambio con respecto al valor anterior
1 ene 1962 año
1.389
+1.389
0.0%
1 ene 1963 año
1.501
+0.112
8.09%
1 ene 1964 año
1.295
-0.206
-13.76%
1 ene 1965 año
1.259
-0.036
-2.76%
1 ene 1966 año
1.22
-0.039
-3.07%
1 ene 1967 año
1.201
-0.019
-1.59%
1 ene 1968 año
1.189
-0.012
-0.99%
1 ene 1969 año
1.289
+0.101
8.47%
1 ene 1970 año
1.295
+0.005
0.42%
1 ene 1971 año
1.295
0.0
0.0%
1 ene 1972 año
1.357
+0.062
4.81%
1 ene 1973 año
1.357
+0.0
0.02%
1 ene 1974 año
1.405
+0.048
3.53%
1 ene 1975 año
1.409
+0.004
0.3%
1 ene 1976 año
1.412
+0.003
0.19%
1 ene 1977 año
1.413
+0.001
0.09%
1 ene 1978 año
1.416
+0.002
0.15%
1 ene 1979 año
1.412
-0.004
-0.27%
1 ene 1980 año
1.414
+0.003
0.18%
1 ene 1981 año
1.479
+0.065
4.6%
1 ene 1982 año
1.531
+0.052
3.51%
1 ene 1983 año
1.535
+0.004
0.26%
1 ene 1984 año
1.598
+0.063
4.1%
1 ene 1985 año
1.603
+0.005
0.29%
1 ene 1986 año
1.607
+0.004
0.23%
1 ene 1987 año
1.654
+0.048
2.97%
1 ene 1988 año
1.755
+0.101
6.08%
1 ene 1989 año
1.757
+0.002
0.13%
1 ene 1990 año
1.762
+0.005
0.27%
1 ene 1991 año
1.803
+0.041
2.33%
1 ene 1992 año
1.876
+0.073
4.05%
1 ene 1993 año
1.942
+0.066
3.5%
1 ene 1994 año
2.038
+0.096
4.94%
1 ene 1995 año
2.07
+0.032
1.57%
1 ene 1996 año
2.121
+0.051
2.48%
1 ene 1997 año
2.24
+0.119
5.63%
1 ene 1998 año
2.245
+0.004
0.2%
1 ene 1999 año
2.276
+0.031
1.4%
1 ene 2000 año
2.403
+0.127
5.57%
1 ene 2001 año
2.411
+0.008
0.31%
1 ene 2002 año
2.489
+0.078
3.25%
1 ene 2003 año
2.507
+0.018
0.72%
1 ene 2004 año
2.602
+0.096
3.81%
1 ene 2005 año
2.671
+0.069
2.64%
1 ene 2006 año
2.736
+0.065
2.44%
1 ene 2007 año
2.858
+0.122
4.46%
1 ene 2008 año
2.952
+0.094
3.29%
1 ene 2009 año
3.003
+0.051
1.73%
1 ene 2010 año
3.093
+0.089
2.97%
1 ene 2011 año
3.184
+0.091
2.95%
1 ene 2012 año
3.221
+0.037
1.16%
1 ene 2013 año
3.315
+0.094
2.91%
1 ene 2014 año
3.352
+0.037
1.12%
1 ene 2015 año
3.355
+0.003
0.1%
Ranking de los países por los datos estadísticos actuales


Comentarios: