29
/es/
es
AIzaSyAYiBZKx7MnpbEhh9jyipgxe19OcubqV5w
April 1, 2024
202052
Morocco
MAR
true
2
1
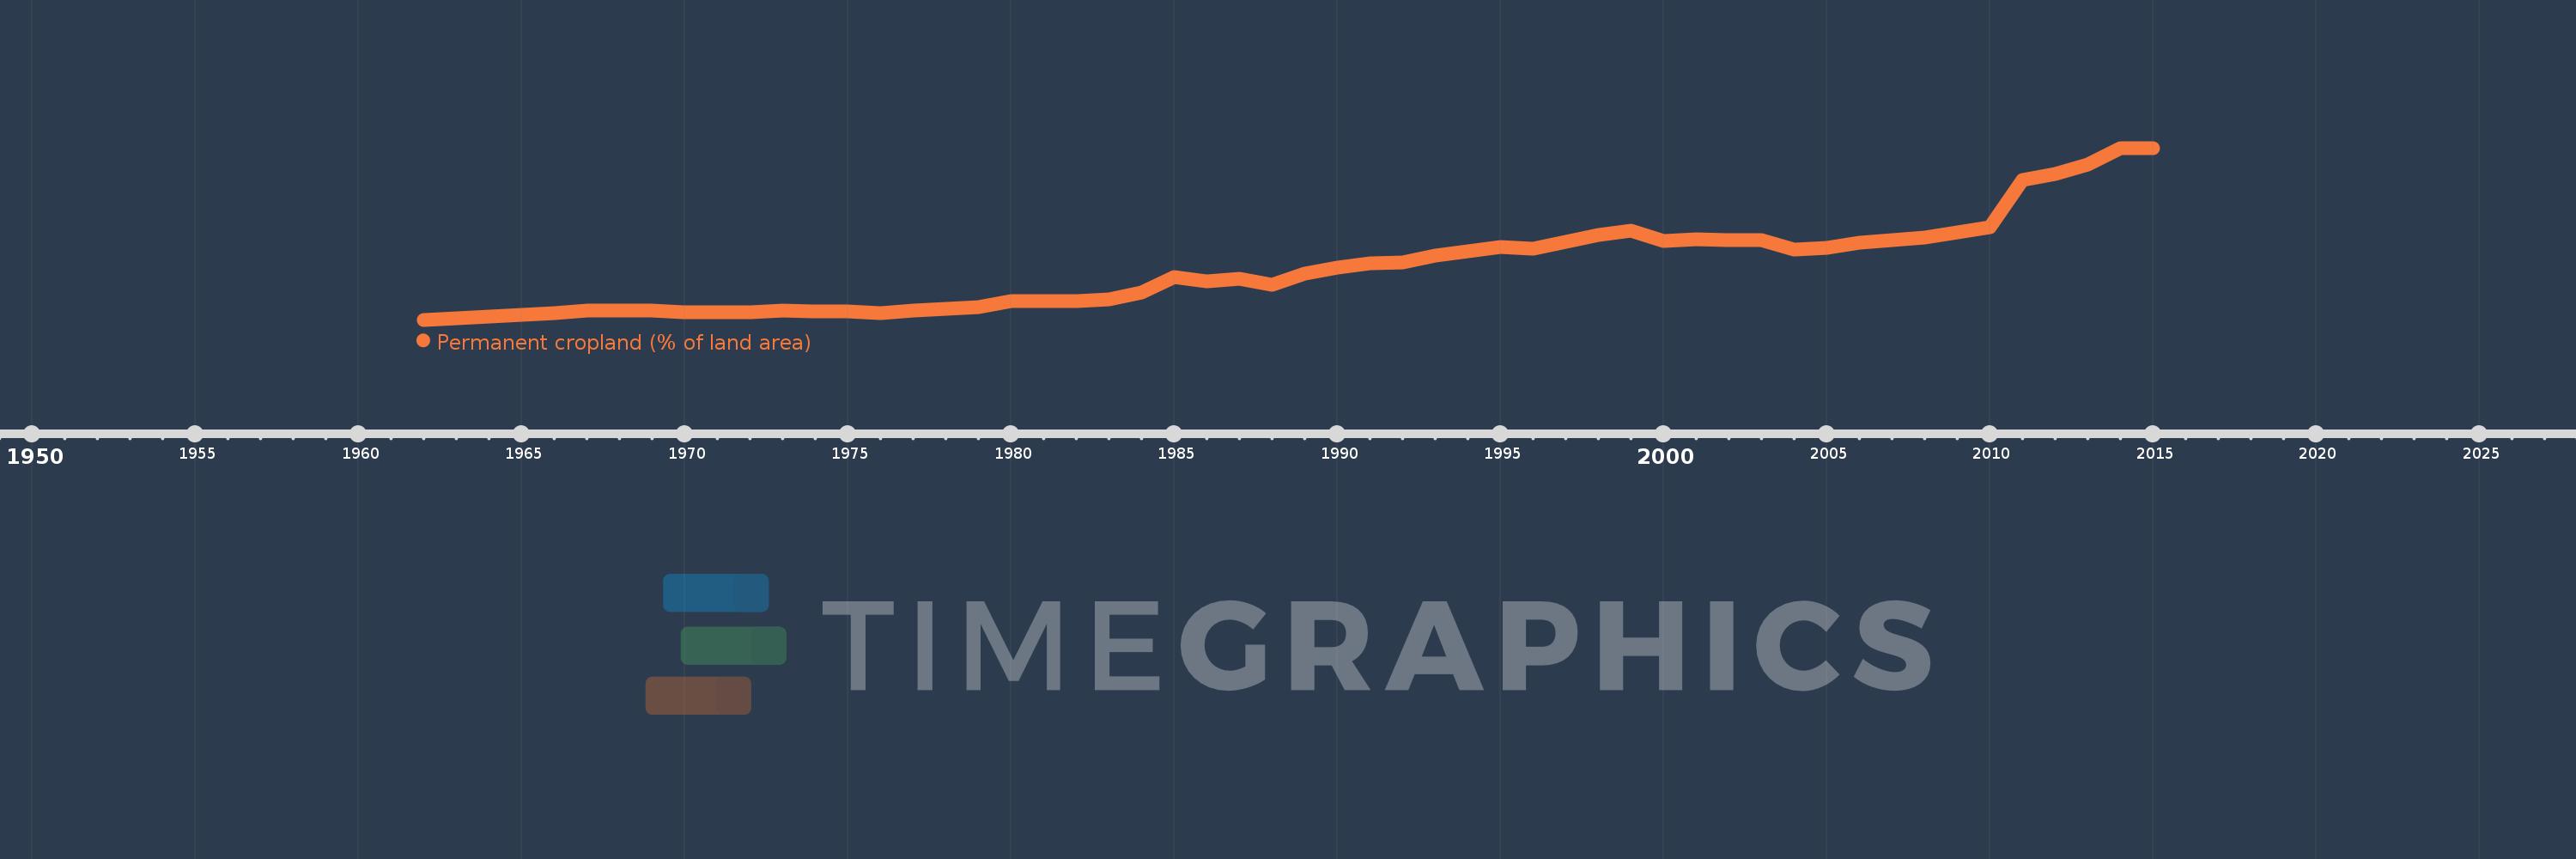
Permanent cropland (% of land area)
2015,2014,2013,2012,2011,2010,2009,2008,2007,2006,2005,2004,2003,2002,2001,2000,1999,1998,1997,1996,1995,1994,1993,1992,1991,1990,1989,1988,1987,1986,1985,1984,1983,1982,1981,1980,1979,1978,1977,1976,1975,1974,1973,1972,1971,1970,1969,1968,1967,1966,1965,1964,1963,1962
Estas estadísticas en otros países:
AfghanistanAlbaniaAlgeriaAmerican SamoaAngolaAntigua and BarbudaArab WorldArgentinaArmeniaAustraliaAustriaAzerbaijanBahamas, TheBahrainBangladeshBarbadosBelarusBelgiumBelizeBeninBhutanBoliviaBosnia and HerzegovinaBotswanaBrazilBritish Virgin IslandsBrunei DarussalamBulgariaBurkina FasoBurundiCabo VerdeCambodiaCameroonCanadaCaribbean small statesCayman IslandsCentral African RepublicCentral Europe and the BalticsChadChileChinaColombiaComorosCongo, Dem. Rep.Congo, Rep.Costa RicaCote d'IvoireCroatiaCubaCyprusCzech RepublicDenmarkDominicaDominican RepublicEarly-demographic dividendEast Asia & PacificEast Asia & Pacific (excluding high income)East Asia & Pacific (IDA & IBRD countries)EcuadorEgypt, Arab Rep.El SalvadorEquatorial GuineaEritreaEstoniaEthiopiaEuro areaEurope & Central AsiaEurope & Central Asia (excluding high income)Europe & Central Asia (IDA & IBRD countries)European UnionFijiFinlandFragile and conflict affected situationsFranceFrench PolynesiaGabonGambia, TheGeorgiaGermanyGhanaGreeceGrenadaGuamGuatemalaGuineaGuinea-BissauGuyanaHaitiHeavily indebted poor countries (HIPC)High incomeHondurasHong Kong SAR, ChinaHungaryIBRD onlyIDA & IBRD totalIDA blendIDA onlyIDA totalIndiaIndonesiaIran, Islamic Rep.IraqIrelandIsraelItalyJamaicaJapanJordanKazakhstanKenyaKiribatiKorea, Dem. People’s Rep.Korea, Rep.KuwaitKyrgyz RepublicLao PDRLate-demographic dividendLatin America & Caribbean Latin America & Caribbean (excluding high income)Latin America & the Caribbean (IDA & IBRD countries)LatviaLeast developed countries: UN classificationLebanonLesothoLiberiaLibyaLithuaniaLow & middle incomeLow incomeLower middle incomeLuxembourgMacedonia, FYRMadagascarMalawiMalaysiaMaldivesMaliMaltaMarshall IslandsMauritaniaMauritiusMexicoMicronesia, Fed. Sts.Middle East & North AfricaMiddle East & North Africa (excluding high income)Middle East & North Africa (IDA & IBRD countries)Middle incomeMoldovaMongoliaMontenegroMoroccoMozambiqueMyanmarNamibiaNauruNepalNetherlandsNew CaledoniaNew ZealandNicaraguaNigerNigeriaNorth AmericaNorthern Mariana IslandsNorwayOECD membersOmanOther small statesPacific island small statesPakistanPalauPanamaPapua New GuineaParaguayPeruPhilippinesPolandPortugalPost-demographic dividendPre-demographic dividendPuerto RicoQatarRomaniaRussian FederationRwandaSamoaSao Tome and PrincipeSaudi ArabiaSenegalSerbiaSeychellesSierra LeoneSingaporeSlovak RepublicSloveniaSmall statesSolomon IslandsSomaliaSouth AfricaSouth AsiaSouth Asia (IDA & IBRD)SpainSri LankaSt. Kitts and NevisSt. LuciaSt. Vincent and the GrenadinesSub-Saharan Africa Sub-Saharan Africa (excluding high income)Sub-Saharan Africa (IDA & IBRD countries)SudanSurinameSwazilandSwedenSwitzerlandSyrian Arab RepublicTajikistanTanzaniaThailandTimor-LesteTogoTongaTrinidad and TobagoTunisiaTurkeyTurkmenistanTuvaluUgandaUkraineUnited Arab EmiratesUnited KingdomUnited StatesUpper middle incomeUruguayUzbekistanVanuatuVenezuela, RBVietnamVirgin Islands (U.S.)West Bank and GazaWorldYemen, Rep.ZambiaZimbabwe línea de tiempo (timeline):
En esta escala de tiempo se presenta un gráfico de 1962 y 2015 de Morocco. Los datos de 1961 están ausentes. El número de observaciones reales por fecha: 54.
Fuente (nombre):
Indicadores del desarrollo mundial
Fuente (organización):
Food and Agriculture Organization, electronic files and web site.
Categorías:
Agriculture & Rural Development
Se ha actualizado:
23 abr 2017 año
Los indicadores de los cambios de valor en los últimos años
Mínimo:
0.851
1 ene 1962 año
Máximo:
3.275
1 ene 2014 año
A la fecha de observación
Valor
Cambio absoluto
El cambio con respecto al valor anterior
1 ene 1962 año
0.851
+0.851
0.0%
1 ene 1963 año
0.874
+0.022
2.63%
1 ene 1964 año
0.896
+0.022
2.56%
1 ene 1965 año
0.919
+0.022
2.5%
1 ene 1966 año
0.941
+0.022
2.44%
1 ene 1967 año
0.981
+0.04
4.29%
1 ene 1968 año
0.981
0.0
0.0%
1 ene 1969 año
0.981
0.0
0.0%
1 ene 1970 año
0.961
-0.02
-2.05%
1 ene 1971 año
0.961
0.0
0.0%
1 ene 1972 año
0.961
0.0
0.0%
1 ene 1973 año
0.984
+0.022
2.33%
1 ene 1974 año
0.963
-0.02
-2.04%
1 ene 1975 año
0.963
0.0
0.0%
1 ene 1976 año
0.95
-0.013
-1.4%
1 ene 1977 año
0.975
+0.025
2.59%
1 ene 1978 año
1.008
+0.034
3.45%
1 ene 1979 año
1.031
+0.022
2.22%
1 ene 1980 año
1.12
+0.09
8.7%
1 ene 1981 año
1.12
0.0
0.0%
1 ene 1982 año
1.12
0.0
0.0%
1 ene 1983 año
1.143
+0.022
2.0%
1 ene 1984 año
1.232
+0.09
7.84%
1 ene 1985 año
1.456
+0.224
18.18%
1 ene 1986 año
1.389
-0.067
-4.62%
1 ene 1987 año
1.434
+0.045
3.23%
1 ene 1988 año
1.344
-0.09
-6.25%
1 ene 1989 año
1.501
+0.157
11.67%
1 ene 1990 año
1.584
+0.083
5.52%
1 ene 1991 año
1.649
+0.065
4.1%
1 ene 1992 año
1.654
+0.004
0.27%
1 ene 1993 año
1.752
+0.099
5.96%
1 ene 1994 año
1.819
+0.067
3.84%
1 ene 1995 año
1.882
+0.063
3.45%
1 ene 1996 año
1.855
-0.027
-1.43%
1 ene 1997 año
1.949
+0.094
5.07%
1 ene 1998 año
2.05
+0.101
5.17%
1 ene 1999 año
2.113
+0.063
3.06%
1 ene 2000 año
1.961
-0.152
-7.21%
1 ene 2001 año
1.983
+0.022
1.14%
1 ene 2002 año
1.976
-0.007
-0.34%
1 ene 2003 año
1.974
-0.002
-0.11%
1 ene 2004 año
1.84
-0.134
-6.81%
1 ene 2005 año
1.862
+0.022
1.22%
1 ene 2006 año
1.943
+0.081
4.33%
1 ene 2007 año
1.976
+0.034
1.73%
1 ene 2008 año
2.005
+0.029
1.47%
1 ene 2009 año
2.082
+0.076
3.8%
1 ene 2010 año
2.158
+0.076
3.66%
1 ene 2011 año
2.821
+0.663
30.74%
1 ene 2012 año
2.913
+0.092
3.26%
1 ene 2013 año
3.038
+0.125
4.31%
1 ene 2014 año
3.275
+0.236
7.78%
1 ene 2015 año
3.275
0.0
0.0%
Ranking de los países por los datos estadísticos actuales


Comentarios: