29
/es/
es
AIzaSyAYiBZKx7MnpbEhh9jyipgxe19OcubqV5w
April 1, 2024
57048
South Asia
SAS
false
2
1
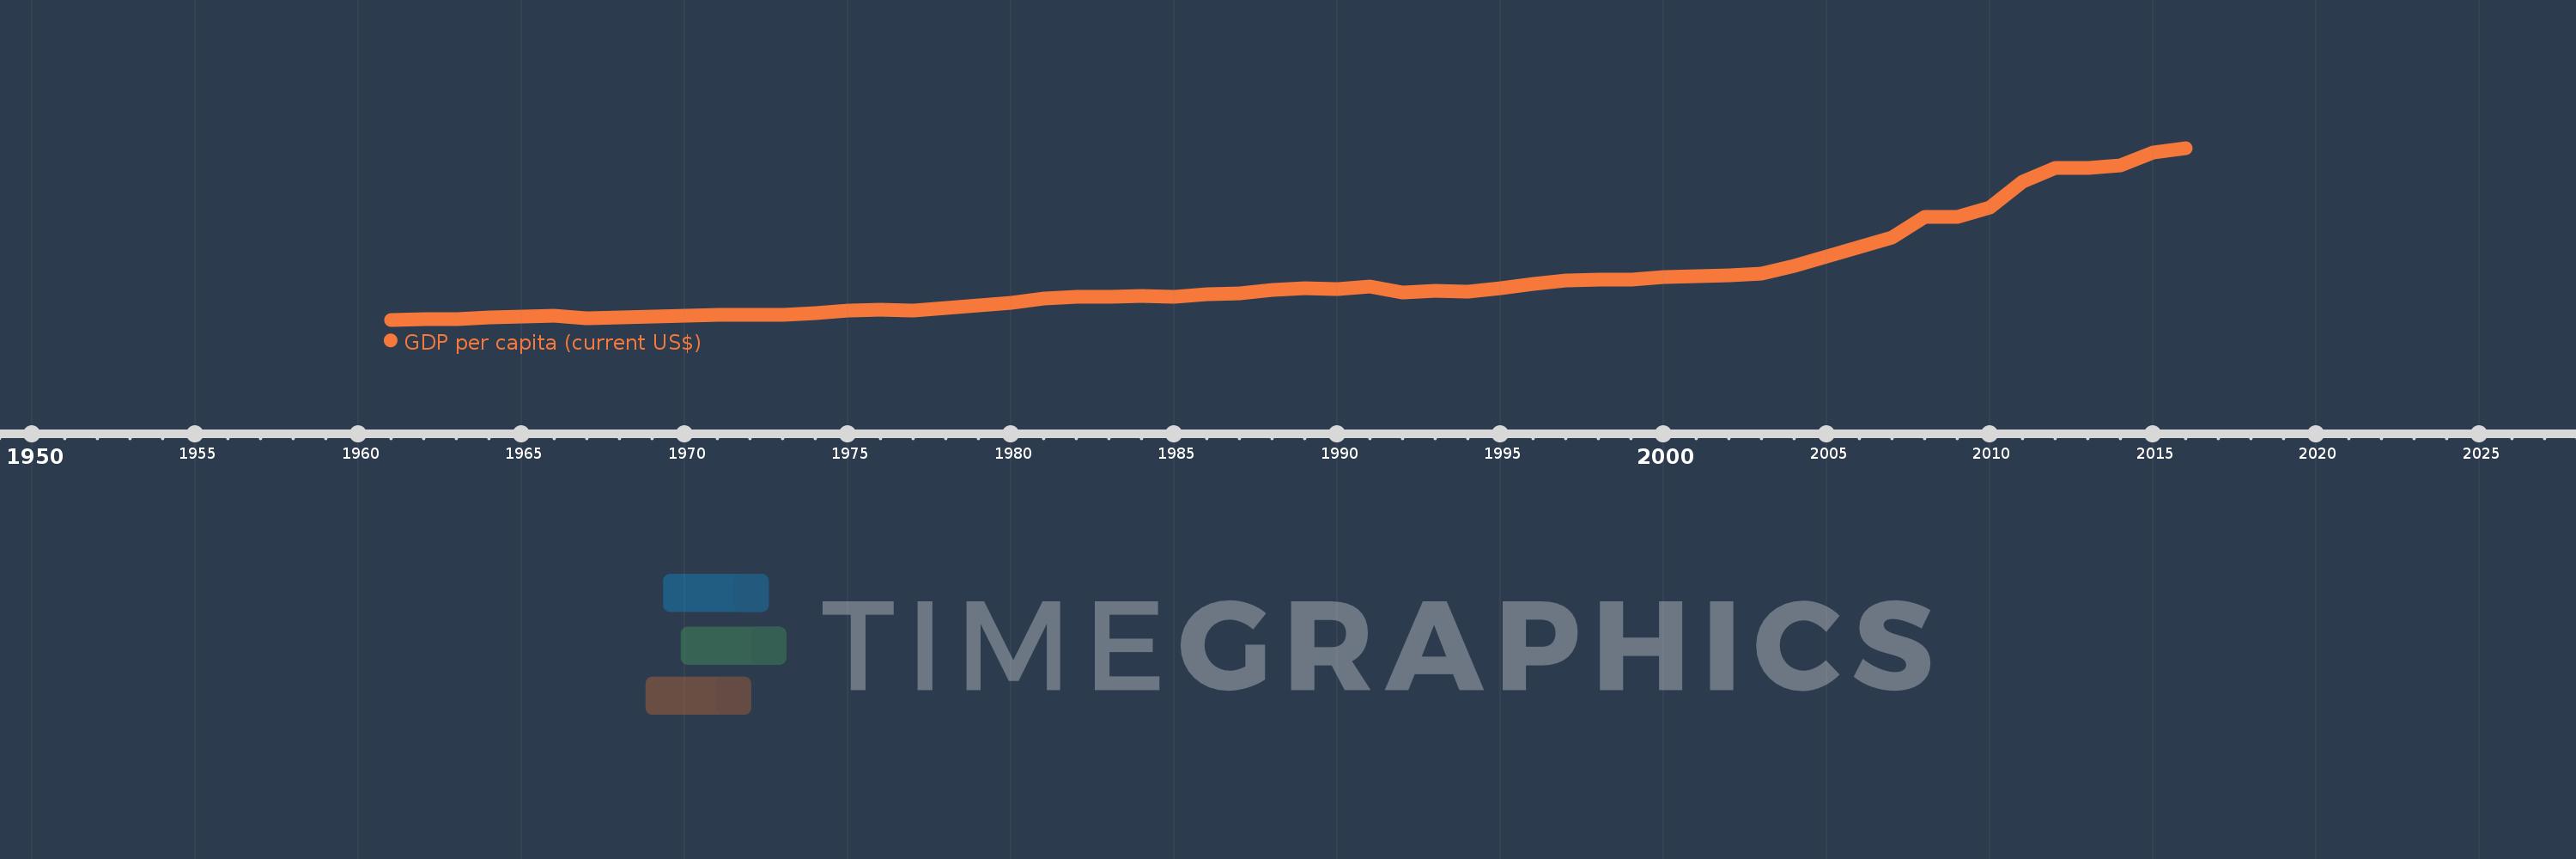
GDP per capita (current US$)
2016,2015,2014,2013,2012,2011,2010,2009,2008,2007,2006,2005,2004,2003,2002,2001,2000,1999,1998,1997,1996,1995,1994,1993,1992,1991,1990,1989,1988,1987,1986,1985,1984,1983,1982,1981,1980,1979,1978,1977,1976,1975,1974,1973,1972,1971,1970,1969,1968,1967,1966,1965,1964,1963,1962,1961
Estas estadísticas en otros países:
AfghanistanAlbaniaAlgeriaAndorraAngolaAntigua and BarbudaArab WorldArgentinaArmeniaArubaAustraliaAustriaAzerbaijanBahamas, TheBahrainBangladeshBarbadosBelarusBelgiumBelizeBeninBermudaBhutanBoliviaBosnia and HerzegovinaBotswanaBrazilBrunei DarussalamBulgariaBurkina FasoBurundiCabo VerdeCambodiaCameroonCanadaCaribbean small statesCayman IslandsCentral African RepublicCentral Europe and the BalticsChadChannel IslandsChileChinaColombiaComorosCongo, Dem. Rep.Congo, Rep.Costa RicaCote d'IvoireCroatiaCubaCyprusCzech RepublicDenmarkDjiboutiDominicaDominican RepublicEarly-demographic dividendEast Asia & PacificEast Asia & Pacific (excluding high income)East Asia & Pacific (IDA & IBRD countries)EcuadorEgypt, Arab Rep.El SalvadorEquatorial GuineaEritreaEstoniaEthiopiaEuro areaEurope & Central AsiaEurope & Central Asia (excluding high income)Europe & Central Asia (IDA & IBRD countries)European UnionFaroe IslandsFijiFinlandFragile and conflict affected situationsFranceFrench PolynesiaGabonGambia, TheGeorgiaGermanyGhanaGreeceGreenlandGrenadaGuatemalaGuineaGuinea-BissauGuyanaHaitiHeavily indebted poor countries (HIPC)High incomeHondurasHong Kong SAR, ChinaHungaryIBRD onlyIcelandIDA & IBRD totalIDA blendIDA onlyIDA totalIndiaIndonesiaIran, Islamic Rep.IraqIrelandIsle of ManIsraelItalyJamaicaJapanJordanKazakhstanKenyaKiribatiKorea, Rep.KosovoKuwaitKyrgyz RepublicLao PDRLate-demographic dividendLatin America & Caribbean Latin America & Caribbean (excluding high income)Latin America & the Caribbean (IDA & IBRD countries)LatviaLeast developed countries: UN classificationLebanonLesothoLiberiaLibyaLiechtensteinLithuaniaLow & middle incomeLow incomeLower middle incomeLuxembourgMacao SAR, ChinaMacedonia, FYRMadagascarMalawiMalaysiaMaldivesMaliMaltaMarshall IslandsMauritaniaMauritiusMexicoMicronesia, Fed. Sts.Middle East & North AfricaMiddle East & North Africa (excluding high income)Middle East & North Africa (IDA & IBRD countries)Middle incomeMoldovaMonacoMongoliaMontenegroMoroccoMozambiqueMyanmarNamibiaNauruNepalNetherlandsNew CaledoniaNew ZealandNicaraguaNigerNigeriaNorth AmericaNorwayOECD membersOmanOther small statesPacific island small statesPakistanPalauPanamaPapua New GuineaParaguayPeruPhilippinesPolandPortugalPost-demographic dividendPre-demographic dividendPuerto RicoQatarRomaniaRussian FederationRwandaSamoaSan MarinoSao Tome and PrincipeSaudi ArabiaSenegalSerbiaSeychellesSierra LeoneSingaporeSlovak RepublicSloveniaSmall statesSolomon IslandsSomaliaSouth AfricaSouth AsiaSouth Asia (IDA & IBRD)South SudanSpainSri LankaSt. Kitts and NevisSt. LuciaSt. Vincent and the GrenadinesSub-Saharan Africa Sub-Saharan Africa (excluding high income)Sub-Saharan Africa (IDA & IBRD countries)SudanSurinameSwazilandSwedenSwitzerlandSyrian Arab RepublicTajikistanTanzaniaThailandTimor-LesteTogoTongaTrinidad and TobagoTunisiaTurkeyTurkmenistanTuvaluUgandaUkraineUnited Arab EmiratesUnited KingdomUnited StatesUpper middle incomeUruguayUzbekistanVanuatuVenezuela, RBVietnamVirgin Islands (U.S.)West Bank and GazaWorldYemen, Rep.ZambiaZimbabwe línea de tiempo (timeline):
En esta escala de tiempo se presenta un gráfico de 1961 y 2016 de South Asia. Los datos de 1960 están ausentes. El número de observaciones reales por fecha: 56.
Fuente (nombre):
Indicadores del desarrollo mundial
Fuente (organización):
World Bank national accounts data, and OECD National Accounts data files.
Categorías:
Economy & Growth
Se ha actualizado:
23 abr 2017 año
Los indicadores de los cambios de valor en los últimos años
Mínimo:
83.35
1 ene 1961 año
Máximo:
1.542 mil
1 ene 2016 año
A la fecha de observación
Valor
Cambio absoluto
El cambio con respecto al valor anterior
1 ene 1961 año
83.35
+83.35
0.0%
1 ene 1962 año
87.052
+3.702
4.44%
1 ene 1963 año
90.953
+3.901
4.48%
1 ene 1964 año
100.167
+9.214
10.13%
1 ene 1965 año
112.267
+12.1
12.08%
1 ene 1966 año
117.967
+5.7
5.08%
1 ene 1967 año
96.81
-21.156
-17.93%
1 ene 1968 año
104.196
+7.386
7.63%
1 ene 1969 año
106.937
+2.741
2.63%
1 ene 1970 año
114.775
+7.838
7.33%
1 ene 1971 año
121.512
+6.737
5.87%
1 ene 1972 año
126.287
+4.775
3.93%
1 ene 1973 año
124.14
-2.147
-1.7%
1 ene 1974 año
138.88
+14.739
11.87%
1 ene 1975 año
164.256
+25.376
18.27%
1 ene 1976 año
171.905
+7.649
4.66%
1 ene 1977 año
164.111
-7.795
-4.53%
1 ene 1978 año
185.419
+21.308
12.98%
1 ene 1979 año
206.023
+20.604
11.11%
1 ene 1980 año
225.319
+19.297
9.37%
1 ene 1981 año
265.351
+40.031
17.77%
1 ene 1982 año
274.634
+9.283
3.5%
1 ene 1983 año
277.507
+2.873
1.05%
1 ene 1984 año
287.039
+9.531
3.43%
1 ene 1985 año
279.01
-8.029
-2.8%
1 ene 1986 año
296.467
+17.457
6.26%
1 ene 1987 año
306.893
+10.426
3.52%
1 ene 1988 año
333.123
+26.23
8.55%
1 ene 1989 año
349.915
+16.792
5.04%
1 ene 1990 año
345.282
-4.634
-1.32%
1 ene 1991 año
363.656
+18.375
5.32%
1 ene 1992 año
316.184
-47.472
-13.05%
1 ene 1993 año
328.634
+12.449
3.94%
1 ene 1994 año
318.562
-10.072
-3.06%
1 ene 1995 año
354.083
+35.521
11.15%
1 ene 1996 año
385.381
+31.299
8.84%
1 ene 1997 año
413.25
+27.869
7.23%
1 ene 1998 año
425.146
+11.896
2.88%
1 ene 1999 año
422.888
-2.258
-0.53%
1 ene 2000 año
444.744
+21.855
5.17%
1 ene 2001 año
453.995
+9.251
2.08%
1 ene 2002 año
457.618
+3.623
0.8%
1 ene 2003 año
472.781
+15.163
3.31%
1 ene 2004 año
542.707
+69.926
14.79%
1 ene 2005 año
618.808
+76.101
14.02%
1 ene 2006 año
697.554
+78.746
12.73%
1 ene 2007 año
785.012
+87.458
12.54%
1 ene 2008 año
954.991
+169.98
21.65%
1 ene 2009 año
957.838
+2.846
0.3%
1 ene 2010 año
1.037 mil
+79.476
8.3%
1 ene 2011 año
1.254 mil
+216.346
20.86%
1 ene 2012 año
1.375 mil
+121.467
9.69%
1 ene 2013 año
1.373 mil
-2.46
-0.18%
1 ene 2014 año
1.391 mil
+18.757
1.37%
1 ene 2015 año
1.502 mil
+110.258
7.92%
1 ene 2016 año
1.542 mil
+40.527
2.7%
Ranking de los países por los datos estadísticos actuales


Comentarios: