29
/es/
es
AIzaSyAYiBZKx7MnpbEhh9jyipgxe19OcubqV5w
April 1, 2024
178858
Liberia
LBR
true
2
1
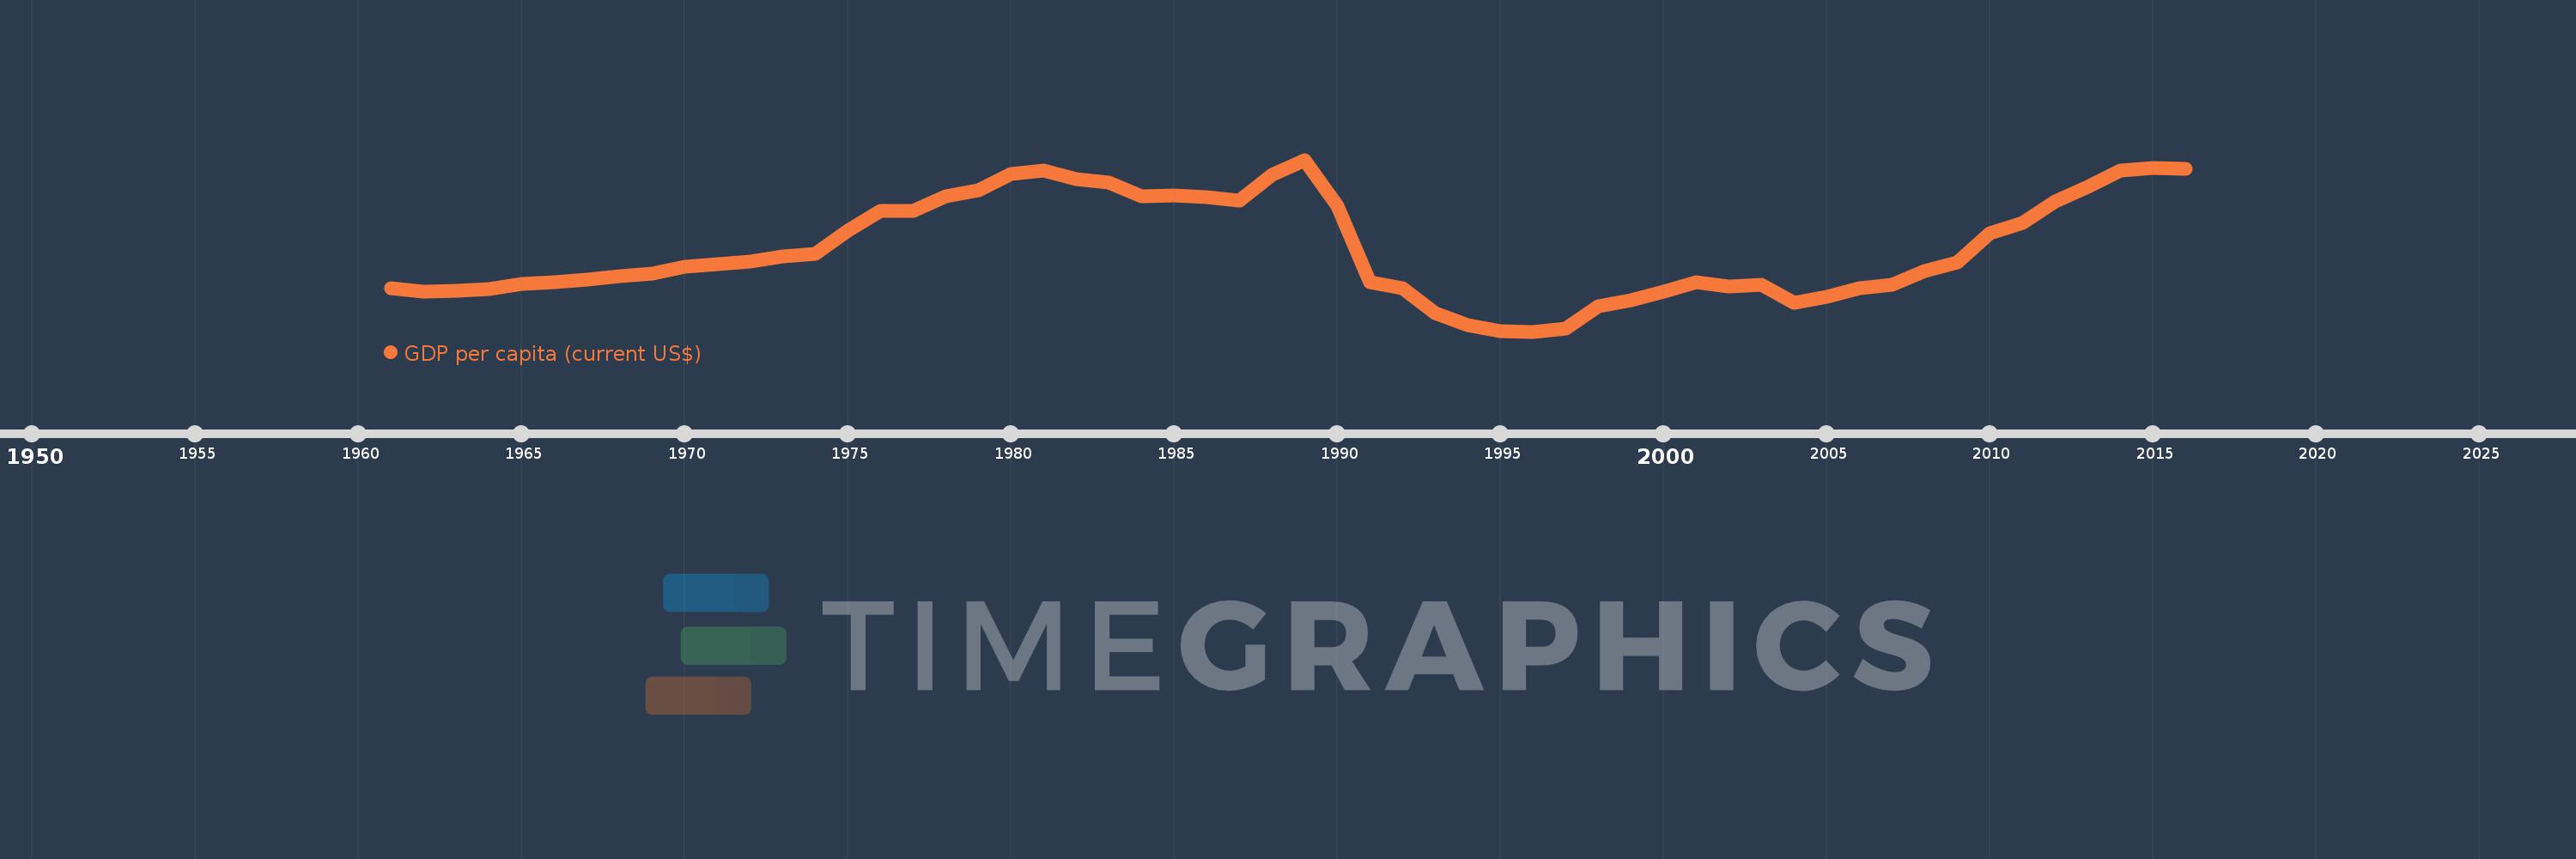
GDP per capita (current US$)
2016,2015,2014,2013,2012,2011,2010,2009,2008,2007,2006,2005,2004,2003,2002,2001,2000,1999,1998,1997,1996,1995,1994,1993,1992,1991,1990,1989,1988,1987,1986,1985,1984,1983,1982,1981,1980,1979,1978,1977,1976,1975,1974,1973,1972,1971,1970,1969,1968,1967,1966,1965,1964,1963,1962,1961
Estas estadísticas en otros países:
AfghanistanAlbaniaAlgeriaAndorraAngolaAntigua and BarbudaArab WorldArgentinaArmeniaArubaAustraliaAustriaAzerbaijanBahamas, TheBahrainBangladeshBarbadosBelarusBelgiumBelizeBeninBermudaBhutanBoliviaBosnia and HerzegovinaBotswanaBrazilBrunei DarussalamBulgariaBurkina FasoBurundiCabo VerdeCambodiaCameroonCanadaCaribbean small statesCayman IslandsCentral African RepublicCentral Europe and the BalticsChadChannel IslandsChileChinaColombiaComorosCongo, Dem. Rep.Congo, Rep.Costa RicaCote d'IvoireCroatiaCubaCyprusCzech RepublicDenmarkDjiboutiDominicaDominican RepublicEarly-demographic dividendEast Asia & PacificEast Asia & Pacific (excluding high income)East Asia & Pacific (IDA & IBRD countries)EcuadorEgypt, Arab Rep.El SalvadorEquatorial GuineaEritreaEstoniaEthiopiaEuro areaEurope & Central AsiaEurope & Central Asia (excluding high income)Europe & Central Asia (IDA & IBRD countries)European UnionFaroe IslandsFijiFinlandFragile and conflict affected situationsFranceFrench PolynesiaGabonGambia, TheGeorgiaGermanyGhanaGreeceGreenlandGrenadaGuatemalaGuineaGuinea-BissauGuyanaHaitiHeavily indebted poor countries (HIPC)High incomeHondurasHong Kong SAR, ChinaHungaryIBRD onlyIcelandIDA & IBRD totalIDA blendIDA onlyIDA totalIndiaIndonesiaIran, Islamic Rep.IraqIrelandIsle of ManIsraelItalyJamaicaJapanJordanKazakhstanKenyaKiribatiKorea, Rep.KosovoKuwaitKyrgyz RepublicLao PDRLate-demographic dividendLatin America & Caribbean Latin America & Caribbean (excluding high income)Latin America & the Caribbean (IDA & IBRD countries)LatviaLeast developed countries: UN classificationLebanonLesothoLiberiaLibyaLiechtensteinLithuaniaLow & middle incomeLow incomeLower middle incomeLuxembourgMacao SAR, ChinaMacedonia, FYRMadagascarMalawiMalaysiaMaldivesMaliMaltaMarshall IslandsMauritaniaMauritiusMexicoMicronesia, Fed. Sts.Middle East & North AfricaMiddle East & North Africa (excluding high income)Middle East & North Africa (IDA & IBRD countries)Middle incomeMoldovaMonacoMongoliaMontenegroMoroccoMozambiqueMyanmarNamibiaNauruNepalNetherlandsNew CaledoniaNew ZealandNicaraguaNigerNigeriaNorth AmericaNorwayOECD membersOmanOther small statesPacific island small statesPakistanPalauPanamaPapua New GuineaParaguayPeruPhilippinesPolandPortugalPost-demographic dividendPre-demographic dividendPuerto RicoQatarRomaniaRussian FederationRwandaSamoaSan MarinoSao Tome and PrincipeSaudi ArabiaSenegalSerbiaSeychellesSierra LeoneSingaporeSlovak RepublicSloveniaSmall statesSolomon IslandsSomaliaSouth AfricaSouth AsiaSouth Asia (IDA & IBRD)South SudanSpainSri LankaSt. Kitts and NevisSt. LuciaSt. Vincent and the GrenadinesSub-Saharan Africa Sub-Saharan Africa (excluding high income)Sub-Saharan Africa (IDA & IBRD countries)SudanSurinameSwazilandSwedenSwitzerlandSyrian Arab RepublicTajikistanTanzaniaThailandTimor-LesteTogoTongaTrinidad and TobagoTunisiaTurkeyTurkmenistanTuvaluUgandaUkraineUnited Arab EmiratesUnited KingdomUnited StatesUpper middle incomeUruguayUzbekistanVanuatuVenezuela, RBVietnamVirgin Islands (U.S.)West Bank and GazaWorldYemen, Rep.ZambiaZimbabwe línea de tiempo (timeline):
En esta escala de tiempo se presenta un gráfico de 1961 y 2016 de Liberia. Los datos de 1960 están ausentes. El número de observaciones reales por fecha: 56.
Fuente (nombre):
Indicadores del desarrollo mundial
Fuente (organización):
World Bank national accounts data, and OECD National Accounts data files.
Categorías:
Economy & Growth
Se ha actualizado:
23 abr 2017 año
Los indicadores de los cambios de valor en los últimos años
Mínimo:
64.81
1 ene 1996 año
Máximo:
478.385
1 ene 1989 año
A la fecha de observación
Valor
Cambio absoluto
El cambio con respecto al valor anterior
1 ene 1961 año
170.038
+170.038
0.0%
1 ene 1962 año
160.644
-9.393
-5.52%
1 ene 1963 año
163.947
+3.303
2.06%
1 ene 1964 año
167.334
+3.387
2.07%
1 ene 1965 año
178.85
+11.516
6.88%
1 ene 1966 año
182.974
+4.124
2.31%
1 ene 1967 año
190.492
+7.518
4.11%
1 ene 1968 año
198.48
+7.987
4.19%
1 ene 1969 año
205.288
+6.809
3.43%
1 ene 1970 año
221.905
+16.616
8.09%
1 ene 1971 año
227.579
+5.674
2.56%
1 ene 1972 año
234.3
+6.722
2.95%
1 ene 1973 año
245.832
+11.531
4.92%
1 ene 1974 año
251.461
+5.629
2.29%
1 ene 1975 año
307.696
+56.235
22.36%
1 ene 1976 año
354.617
+46.921
15.25%
1 ene 1977 año
356.008
+1.391
0.39%
1 ene 1978 año
390.307
+34.298
9.63%
1 ene 1979 año
404.034
+13.727
3.52%
1 ene 1980 año
444.612
+40.578
10.04%
1 ene 1981 año
451.624
+7.012
1.58%
1 ene 1982 año
431.5
-20.124
-4.46%
1 ene 1983 año
424.261
-7.239
-1.68%
1 ene 1984 año
390.684
-33.577
-7.91%
1 ene 1985 año
392.118
+1.434
0.37%
1 ene 1986 año
387.403
-4.715
-1.2%
1 ene 1987 año
381.067
-6.336
-1.64%
1 ene 1988 año
442.946
+61.879
16.24%
1 ene 1989 año
478.385
+35.439
8.0%
1 ene 1990 año
367.943
-110.443
-23.09%
1 ene 1991 año
182.797
-185.145
-50.32%
1 ene 1992 año
168.437
-14.361
-7.86%
1 ene 1993 año
110.171
-58.266
-34.59%
1 ene 1994 año
79.946
-30.224
-27.43%
1 ene 1995 año
65.473
-14.473
-18.1%
1 ene 1996 año
64.81
-0.663
-1.01%
1 ene 1997 año
72.527
+7.717
11.91%
1 ene 1998 año
125.101
+52.574
72.49%
1 ene 1999 año
140.574
+15.473
12.37%
1 ene 2000 año
161.138
+20.564
14.63%
1 ene 2001 año
182.943
+21.805
13.53%
1 ene 2002 año
173.738
-9.205
-5.03%
1 ene 2003 año
176.834
+3.096
1.78%
1 ene 2004 año
133.153
-43.681
-24.7%
1 ene 2005 año
149.059
+15.906
11.95%
1 ene 2006 año
168.207
+19.148
12.85%
1 ene 2007 año
178.453
+10.246
6.09%
1 ene 2008 año
209.812
+31.358
17.57%
1 ene 2009 año
231.443
+21.632
10.31%
1 ene 2010 año
302.276
+70.833
30.6%
1 ene 2011 año
326.604
+24.328
8.05%
1 ene 2012 año
378.814
+52.21
15.99%
1 ene 2013 año
414.185
+35.371
9.34%
1 ene 2014 año
453.339
+39.154
9.45%
1 ene 2015 año
457.859
+4.519
1.0%
1 ene 2016 año
455.874
-1.985
-0.43%
Ranking de los países por los datos estadísticos actuales


Comentarios: