29
/es/
es
AIzaSyAYiBZKx7MnpbEhh9jyipgxe19OcubqV5w
April 1, 2024
55737
Pre-demographic dividend
PRE
false
2
1
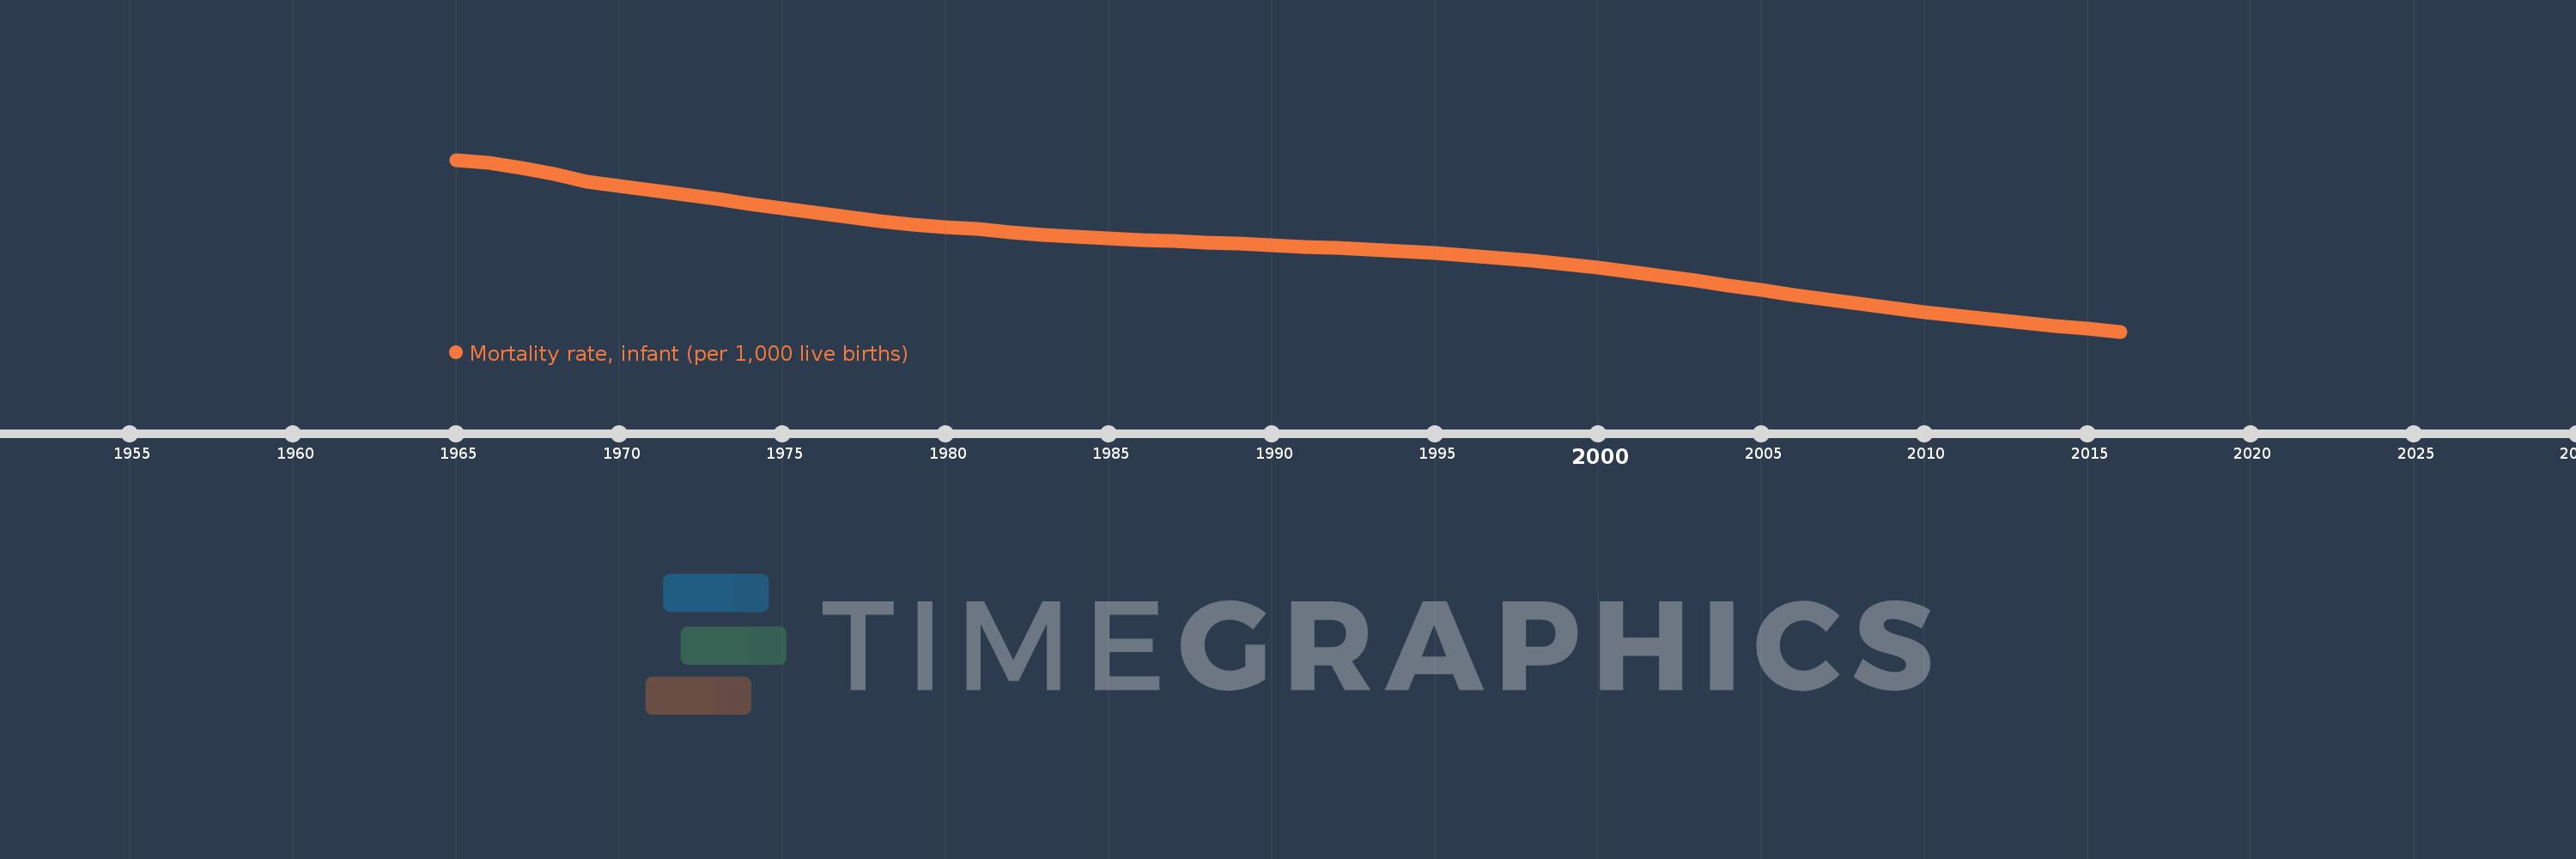
Mortality rate, infant (per 1,000 live births)
2016,2015,2014,2013,2012,2011,2010,2009,2008,2007,2006,2005,2004,2003,2002,2001,2000,1999,1998,1997,1996,1995,1994,1993,1992,1991,1990,1989,1988,1987,1986,1985,1984,1983,1982,1981,1980,1979,1978,1977,1976,1975,1974,1973,1972,1971,1970,1969,1968,1967,1966,1965
Estas estadísticas en otros países:
AfghanistanAlbaniaAlgeriaAndorraAngolaAntigua and BarbudaArab WorldArgentinaArmeniaAustraliaAustriaAzerbaijanBahamas, TheBahrainBangladeshBarbadosBelarusBelgiumBelizeBeninBhutanBoliviaBosnia and HerzegovinaBotswanaBrazilBrunei DarussalamBulgariaBurkina FasoBurundiCabo VerdeCambodiaCameroonCanadaCaribbean small statesCentral African RepublicCentral Europe and the BalticsChadChileChinaColombiaComorosCongo, Dem. Rep.Congo, Rep.Costa RicaCote d'IvoireCroatiaCubaCyprusCzech RepublicDenmarkDjiboutiDominicaDominican RepublicEarly-demographic dividendEast Asia & PacificEast Asia & Pacific (excluding high income)East Asia & Pacific (IDA & IBRD countries)EcuadorEgypt, Arab Rep.El SalvadorEquatorial GuineaEritreaEstoniaEthiopiaEuro areaEurope & Central AsiaEurope & Central Asia (excluding high income)Europe & Central Asia (IDA & IBRD countries)European UnionFijiFinlandFragile and conflict affected situationsFranceGabonGambia, TheGeorgiaGermanyGhanaGreeceGrenadaGuatemalaGuineaGuinea-BissauGuyanaHaitiHeavily indebted poor countries (HIPC)High incomeHondurasHungaryIBRD onlyIcelandIDA & IBRD totalIDA blendIDA onlyIDA totalIndiaIndonesiaIran, Islamic Rep.IraqIrelandIsraelItalyJamaicaJapanJordanKazakhstanKenyaKiribatiKorea, Dem. People’s Rep.Korea, Rep.KuwaitKyrgyz RepublicLao PDRLate-demographic dividendLatin America & Caribbean Latin America & Caribbean (excluding high income)Latin America & the Caribbean (IDA & IBRD countries)LatviaLeast developed countries: UN classificationLebanonLesothoLiberiaLibyaLithuaniaLow & middle incomeLow incomeLower middle incomeLuxembourgMacedonia, FYRMadagascarMalawiMalaysiaMaldivesMaliMaltaMarshall IslandsMauritaniaMauritiusMexicoMicronesia, Fed. Sts.Middle East & North AfricaMiddle East & North Africa (excluding high income)Middle East & North Africa (IDA & IBRD countries)Middle incomeMoldovaMonacoMongoliaMontenegroMoroccoMozambiqueMyanmarNamibiaNauruNepalNetherlandsNew ZealandNicaraguaNigerNigeriaNorth AmericaNorwayOECD membersOmanOther small statesPacific island small statesPakistanPalauPanamaPapua New GuineaParaguayPeruPhilippinesPolandPortugalPost-demographic dividendPre-demographic dividendQatarRomaniaRussian FederationRwandaSamoaSan MarinoSao Tome and PrincipeSaudi ArabiaSenegalSerbiaSeychellesSierra LeoneSingaporeSlovak RepublicSloveniaSmall statesSolomon IslandsSomaliaSouth AfricaSouth AsiaSouth Asia (IDA & IBRD)South SudanSpainSri LankaSt. Kitts and NevisSt. LuciaSt. Vincent and the GrenadinesSub-Saharan Africa Sub-Saharan Africa (excluding high income)Sub-Saharan Africa (IDA & IBRD countries)SudanSurinameSwazilandSwedenSwitzerlandSyrian Arab RepublicTajikistanTanzaniaThailandTimor-LesteTogoTongaTrinidad and TobagoTunisiaTurkeyTurkmenistanTuvaluUgandaUkraineUnited Arab EmiratesUnited KingdomUnited StatesUpper middle incomeUruguayUzbekistanVanuatuVenezuela, RBVietnamWest Bank and GazaWorldYemen, Rep.ZambiaZimbabwe línea de tiempo (timeline):
En esta escala de tiempo se presenta un gráfico de 1965 y 2016 de Pre-demographic dividend. Los datos de 1964 están ausentes. El número de observaciones reales por fecha: 52.
Fuente (nombre):
Indicadores del desarrollo mundial
Fuente (organización):
Estimates Developed by the UN Inter-agency Group for Child Mortality Estimation (UNICEF, WHO, World Bank, UN DESA Population Division) at www.childmortality.org. Projected data are from the United Nations Population Division's World Population Prospects; and may in some cases not be consistent with data before the current year.
Categorías:
Health
Se ha actualizado:
23 abr 2017 año
Los indicadores de los cambios de valor en los últimos años
Mínimo:
58.706
1 ene 2016 año
Máximo:
166.037
1 ene 1965 año
A la fecha de observación
Valor
Cambio absoluto
El cambio con respecto al valor anterior
1 ene 1965 año
166.037
+166.037
0.0%
1 ene 1966 año
163.906
-2.131
-1.28%
1 ene 1967 año
160.842
-3.064
-1.87%
1 ene 1968 año
157.167
-3.675
-2.29%
1 ene 1969 año
152.197
-4.97
-3.16%
1 ene 1970 año
149.569
-2.628
-1.73%
1 ene 1971 año
146.89
-2.679
-1.79%
1 ene 1972 año
144.227
-2.662
-1.81%
1 ene 1973 año
141.379
-2.848
-1.97%
1 ene 1974 año
138.65
-2.729
-1.93%
1 ene 1975 año
135.857
-2.793
-2.01%
1 ene 1976 año
133.144
-2.713
-2.0%
1 ene 1977 año
130.49
-2.654
-1.99%
1 ene 1978 año
127.912
-2.578
-1.98%
1 ene 1979 año
125.47
-2.442
-1.91%
1 ene 1980 año
124.124
-1.346
-1.07%
1 ene 1981 año
122.599
-1.524
-1.23%
1 ene 1982 año
120.886
-1.713
-1.4%
1 ene 1983 año
119.347
-1.54
-1.27%
1 ene 1984 año
117.939
-1.407
-1.18%
1 ene 1985 año
116.78
-1.16
-0.98%
1 ene 1986 año
115.852
-0.928
-0.79%
1 ene 1987 año
115.159
-0.693
-0.6%
1 ene 1988 año
114.332
-0.827
-0.72%
1 ene 1989 año
113.496
-0.836
-0.73%
1 ene 1990 año
112.639
-0.856
-0.75%
1 ene 1991 año
111.711
-0.928
-0.82%
1 ene 1992 año
110.767
-0.944
-0.85%
1 ene 1993 año
109.77
-0.997
-0.9%
1 ene 1994 año
108.76
-1.01
-0.92%
1 ene 1995 año
107.61
-1.151
-1.06%
1 ene 1996 año
106.338
-1.272
-1.18%
1 ene 1997 año
104.832
-1.505
-1.42%
1 ene 1998 año
103.087
-1.745
-1.66%
1 ene 1999 año
101.038
-2.049
-1.99%
1 ene 2000 año
98.749
-2.289
-2.27%
1 ene 2001 año
96.2
-2.549
-2.58%
1 ene 2002 año
93.406
-2.794
-2.9%
1 ene 2003 año
90.452
-2.955
-3.16%
1 ene 2004 año
87.483
-2.968
-3.28%
1 ene 2005 año
84.529
-2.954
-3.38%
1 ene 2006 año
81.591
-2.938
-3.48%
1 ene 2007 año
78.807
-2.785
-3.41%
1 ene 2008 año
76.022
-2.784
-3.53%
1 ene 2009 año
73.369
-2.653
-3.49%
1 ene 2010 año
70.899
-2.47
-3.37%
1 ene 2011 año
68.57
-2.329
-3.29%
1 ene 2012 año
66.298
-2.271
-3.31%
1 ene 2013 año
64.115
-2.183
-3.29%
1 ene 2014 año
62.218
-1.897
-2.96%
1 ene 2015 año
60.361
-1.857
-2.99%
1 ene 2016 año
58.706
-1.656
-2.74%
Ranking de los países por los datos estadísticos actuales


Comentarios: