29
/es/
es
AIzaSyAYiBZKx7MnpbEhh9jyipgxe19OcubqV5w
April 1, 2024
25114
Caribbean small states
CSS
false
2
1
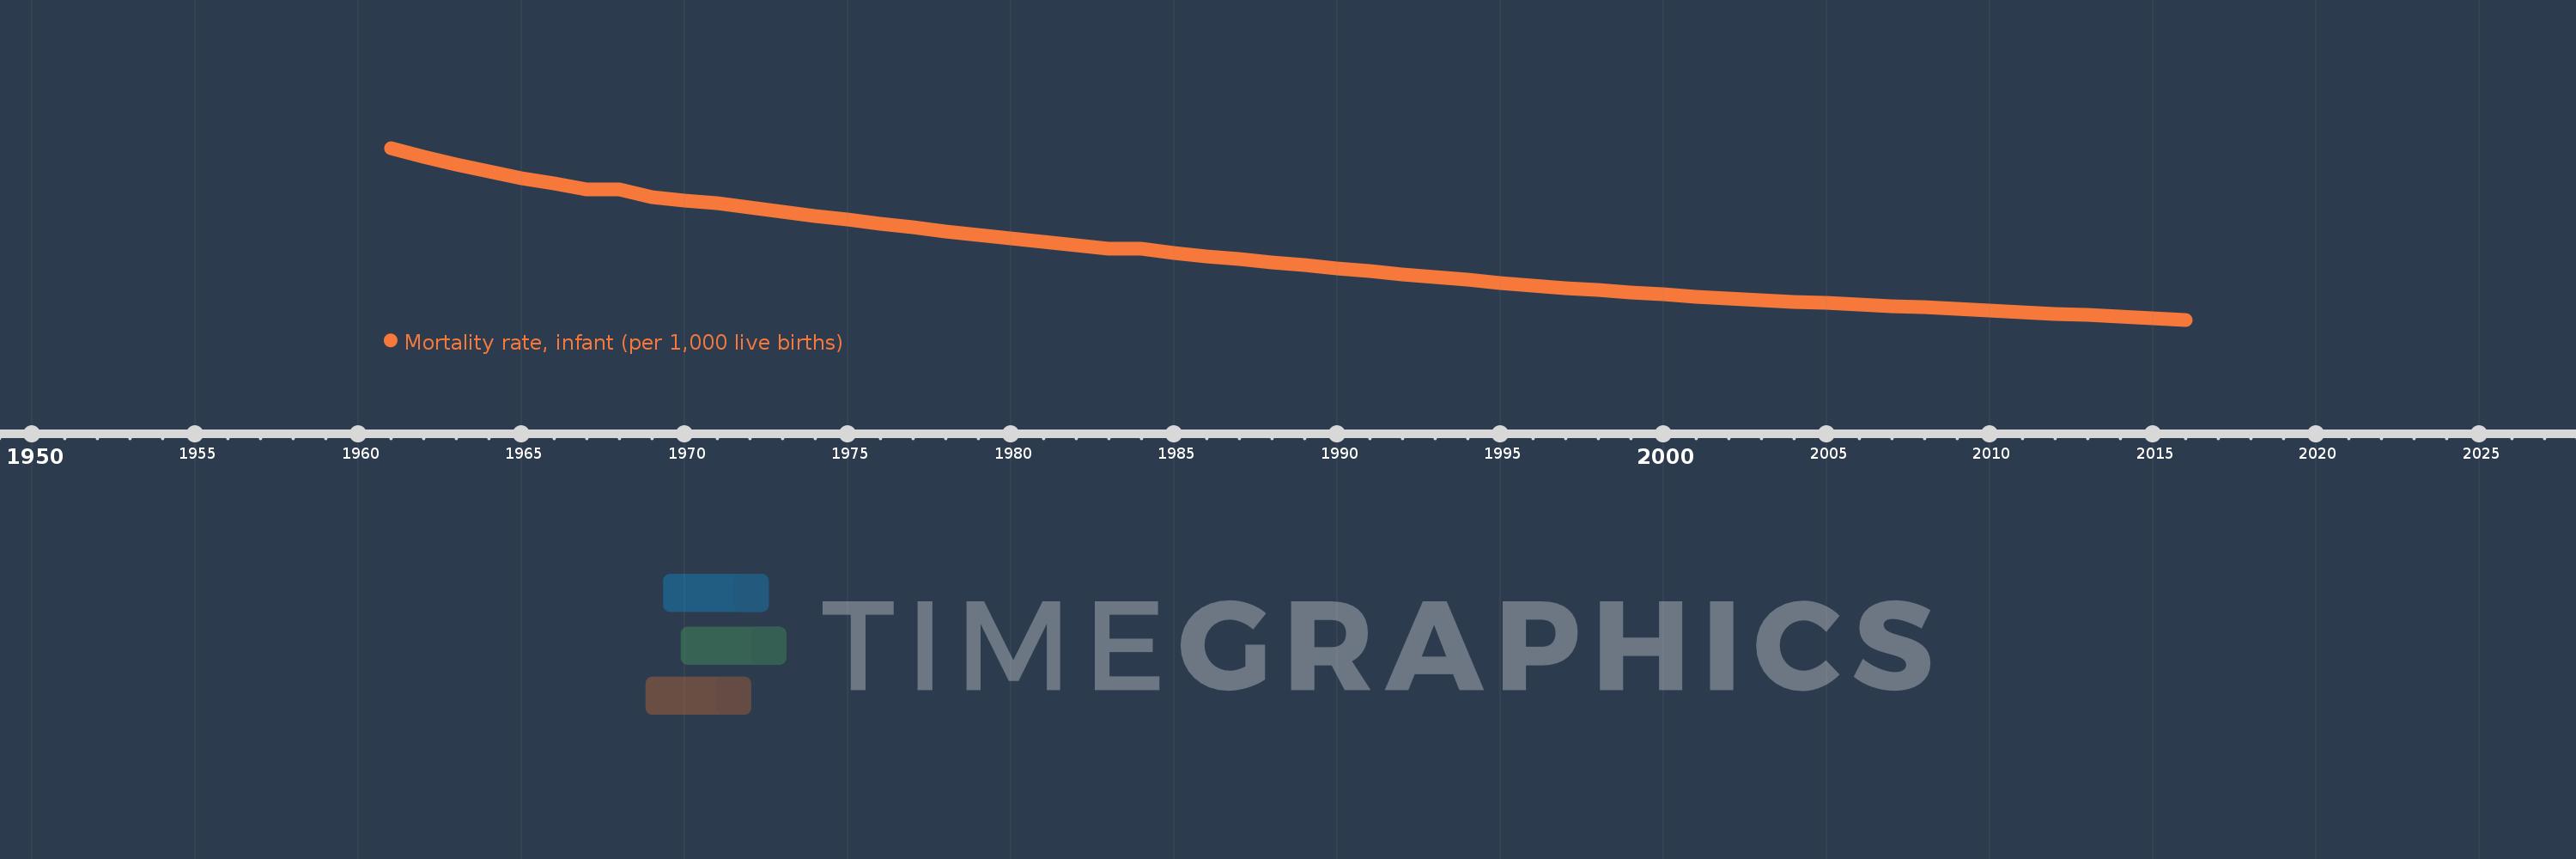
Mortality rate, infant (per 1,000 live births)
2016,2015,2014,2013,2012,2011,2010,2009,2008,2007,2006,2005,2004,2003,2002,2001,2000,1999,1998,1997,1996,1995,1994,1993,1992,1991,1990,1989,1988,1987,1986,1985,1984,1983,1982,1981,1980,1979,1978,1977,1976,1975,1974,1973,1972,1971,1970,1969,1968,1967,1966,1965,1964,1963,1962,1961
Estas estadísticas en otros países:
AfghanistanAlbaniaAlgeriaAndorraAngolaAntigua and BarbudaArab WorldArgentinaArmeniaAustraliaAustriaAzerbaijanBahamas, TheBahrainBangladeshBarbadosBelarusBelgiumBelizeBeninBhutanBoliviaBosnia and HerzegovinaBotswanaBrazilBrunei DarussalamBulgariaBurkina FasoBurundiCabo VerdeCambodiaCameroonCanadaCaribbean small statesCentral African RepublicCentral Europe and the BalticsChadChileChinaColombiaComorosCongo, Dem. Rep.Congo, Rep.Costa RicaCote d'IvoireCroatiaCubaCyprusCzech RepublicDenmarkDjiboutiDominicaDominican RepublicEarly-demographic dividendEast Asia & PacificEast Asia & Pacific (excluding high income)East Asia & Pacific (IDA & IBRD countries)EcuadorEgypt, Arab Rep.El SalvadorEquatorial GuineaEritreaEstoniaEthiopiaEuro areaEurope & Central AsiaEurope & Central Asia (excluding high income)Europe & Central Asia (IDA & IBRD countries)European UnionFijiFinlandFragile and conflict affected situationsFranceGabonGambia, TheGeorgiaGermanyGhanaGreeceGrenadaGuatemalaGuineaGuinea-BissauGuyanaHaitiHeavily indebted poor countries (HIPC)High incomeHondurasHungaryIBRD onlyIcelandIDA & IBRD totalIDA blendIDA onlyIDA totalIndiaIndonesiaIran, Islamic Rep.IraqIrelandIsraelItalyJamaicaJapanJordanKazakhstanKenyaKiribatiKorea, Dem. People’s Rep.Korea, Rep.KuwaitKyrgyz RepublicLao PDRLate-demographic dividendLatin America & Caribbean Latin America & Caribbean (excluding high income)Latin America & the Caribbean (IDA & IBRD countries)LatviaLeast developed countries: UN classificationLebanonLesothoLiberiaLibyaLithuaniaLow & middle incomeLow incomeLower middle incomeLuxembourgMacedonia, FYRMadagascarMalawiMalaysiaMaldivesMaliMaltaMarshall IslandsMauritaniaMauritiusMexicoMicronesia, Fed. Sts.Middle East & North AfricaMiddle East & North Africa (excluding high income)Middle East & North Africa (IDA & IBRD countries)Middle incomeMoldovaMonacoMongoliaMontenegroMoroccoMozambiqueMyanmarNamibiaNauruNepalNetherlandsNew ZealandNicaraguaNigerNigeriaNorth AmericaNorwayOECD membersOmanOther small statesPacific island small statesPakistanPalauPanamaPapua New GuineaParaguayPeruPhilippinesPolandPortugalPost-demographic dividendPre-demographic dividendQatarRomaniaRussian FederationRwandaSamoaSan MarinoSao Tome and PrincipeSaudi ArabiaSenegalSerbiaSeychellesSierra LeoneSingaporeSlovak RepublicSloveniaSmall statesSolomon IslandsSomaliaSouth AfricaSouth AsiaSouth Asia (IDA & IBRD)South SudanSpainSri LankaSt. Kitts and NevisSt. LuciaSt. Vincent and the GrenadinesSub-Saharan Africa Sub-Saharan Africa (excluding high income)Sub-Saharan Africa (IDA & IBRD countries)SudanSurinameSwazilandSwedenSwitzerlandSyrian Arab RepublicTajikistanTanzaniaThailandTimor-LesteTogoTongaTrinidad and TobagoTunisiaTurkeyTurkmenistanTuvaluUgandaUkraineUnited Arab EmiratesUnited KingdomUnited StatesUpper middle incomeUruguayUzbekistanVanuatuVenezuela, RBVietnamWest Bank and GazaWorldYemen, Rep.ZambiaZimbabwe línea de tiempo (timeline):
En esta escala de tiempo se presenta un gráfico de 1961 y 2016 de Caribbean small states. Los datos de 1960 están ausentes. El número de observaciones reales por fecha: 56.
Fuente (nombre):
Indicadores del desarrollo mundial
Fuente (organización):
Estimates Developed by the UN Inter-agency Group for Child Mortality Estimation (UNICEF, WHO, World Bank, UN DESA Population Division) at www.childmortality.org. Projected data are from the United Nations Population Division's World Population Prospects; and may in some cases not be consistent with data before the current year.
Categorías:
Health
Se ha actualizado:
23 abr 2017 año
Los indicadores de los cambios de valor en los últimos años
Mínimo:
16.768
1 ene 2016 año
Máximo:
62.071
1 ene 1961 año
A la fecha de observación
Valor
Cambio absoluto
El cambio con respecto al valor anterior
1 ene 1961 año
62.071
+62.071
0.0%
1 ene 1962 año
59.75
-2.321
-3.74%
1 ene 1963 año
57.674
-2.076
-3.47%
1 ene 1964 año
55.78
-1.894
-3.28%
1 ene 1965 año
54.087
-1.693
-3.04%
1 ene 1966 año
52.612
-1.475
-2.73%
1 ene 1967 año
51.232
-1.38
-2.62%
1 ene 1968 año
51.025
-0.207
-0.4%
1 ene 1969 año
49.077
-1.948
-3.82%
1 ene 1970 año
48.151
-0.926
-1.89%
1 ene 1971 año
47.421
-0.73
-1.52%
1 ene 1972 año
46.31
-1.111
-2.34%
1 ene 1973 año
45.185
-1.124
-2.43%
1 ene 1974 año
44.101
-1.084
-2.4%
1 ene 1975 año
43.101
-1.0
-2.27%
1 ene 1976 año
42.113
-0.988
-2.29%
1 ene 1977 año
41.129
-0.985
-2.34%
1 ene 1978 año
40.097
-1.032
-2.51%
1 ene 1979 año
39.137
-0.96
-2.39%
1 ene 1980 año
38.19
-0.947
-2.42%
1 ene 1981 año
37.238
-0.952
-2.49%
1 ene 1982 año
36.333
-0.905
-2.43%
1 ene 1983 año
35.424
-0.908
-2.5%
1 ene 1984 año
35.478
+0.054
0.15%
1 ene 1985 año
34.311
-1.167
-3.29%
1 ene 1986 año
33.541
-0.77
-2.24%
1 ene 1987 año
32.747
-0.794
-2.37%
1 ene 1988 año
31.944
-0.803
-2.45%
1 ene 1989 año
31.174
-0.769
-2.41%
1 ene 1990 año
30.402
-0.773
-2.48%
1 ene 1991 año
29.592
-0.81
-2.66%
1 ene 1992 año
28.805
-0.787
-2.66%
1 ene 1993 año
28.056
-0.749
-2.6%
1 ene 1994 año
27.296
-0.76
-2.71%
1 ene 1995 año
26.551
-0.745
-2.73%
1 ene 1996 año
25.872
-0.679
-2.56%
1 ene 1997 año
25.191
-0.681
-2.63%
1 ene 1998 año
24.553
-0.638
-2.53%
1 ene 1999 año
23.973
-0.58
-2.36%
1 ene 2000 año
23.419
-0.553
-2.31%
1 ene 2001 año
22.894
-0.525
-2.24%
1 ene 2002 año
22.436
-0.457
-2.0%
1 ene 2003 año
21.984
-0.452
-2.01%
1 ene 2004 año
21.544
-0.441
-2.0%
1 ene 2005 año
21.136
-0.408
-1.89%
1 ene 2006 año
20.76
-0.376
-1.78%
1 ene 2007 año
20.39
-0.37
-1.78%
1 ene 2008 año
20.028
-0.362
-1.78%
1 ene 2009 año
19.623
-0.405
-2.02%
1 ene 2010 año
19.222
-0.401
-2.04%
1 ene 2011 año
18.797
-0.425
-2.21%
1 ene 2012 año
18.398
-0.399
-2.12%
1 ene 2013 año
18.021
-0.377
-2.05%
1 ene 2014 año
17.619
-0.402
-2.23%
1 ene 2015 año
17.173
-0.446
-2.53%
1 ene 2016 año
16.768
-0.405
-2.36%
Ranking de los países por los datos estadísticos actuales


Comentarios: