29
/es/
es
AIzaSyAYiBZKx7MnpbEhh9jyipgxe19OcubqV5w
April 1, 2024
55087
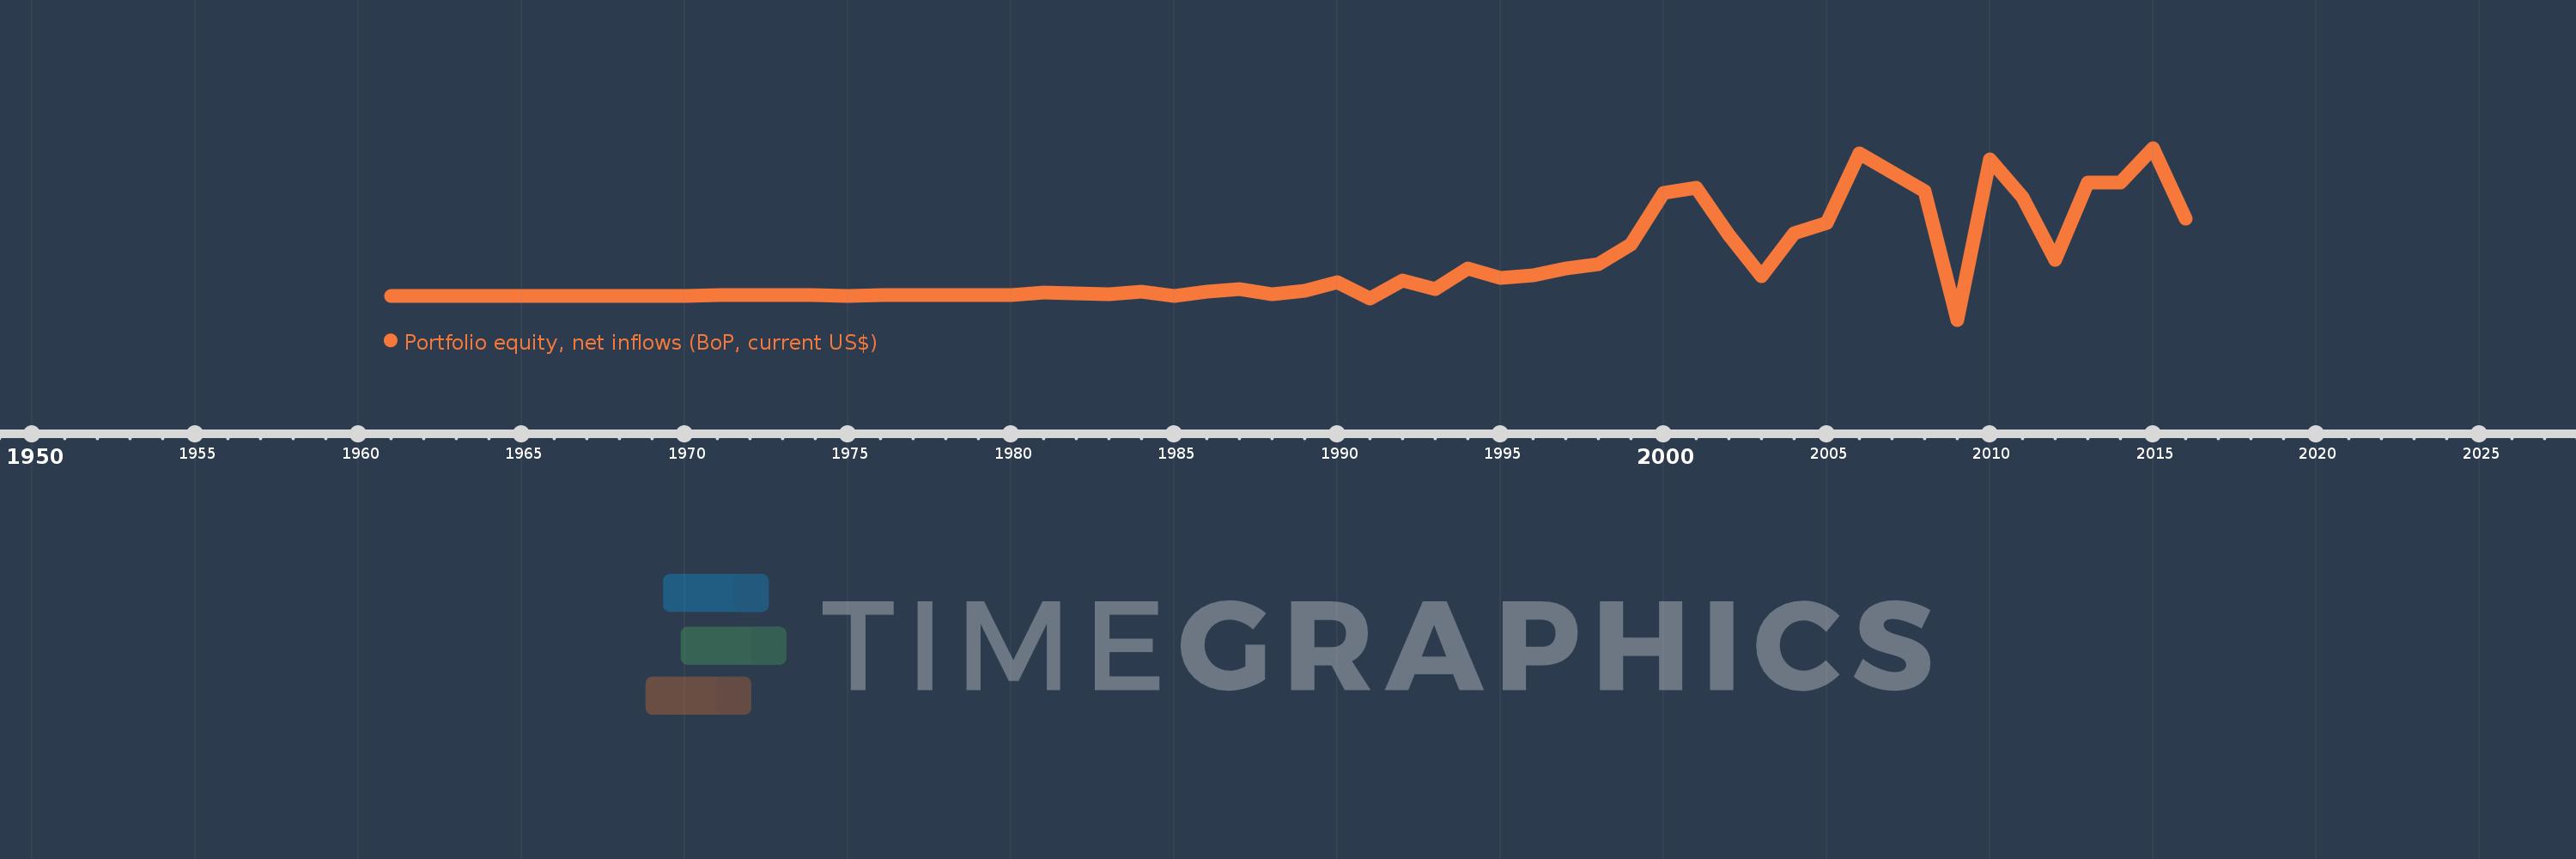
Post-demographic dividend
PST
false
2
1
Portfolio equity, net inflows (BoP, current US$)
2016,2015,2014,2013,2012,2011,2010,2009,2008,2007,2006,2005,2004,2003,2002,2001,2000,1999,1998,1997,1996,1995,1994,1993,1992,1991,1990,1989,1988,1987,1986,1985,1984,1983,1982,1981,1980,1979,1978,1977,1976,1975,1974,1973,1972,1971,1970,1969,1968,1967,1966,1965,1964,1963,1962,1961
Estas estadísticas en otros países:
AfghanistanAlbaniaAlgeriaAngolaAntigua and BarbudaArab WorldArgentinaArmeniaArubaAustraliaAustriaAzerbaijanBahamas, TheBahrainBangladeshBarbadosBelarusBelgiumBelizeBeninBermudaBhutanBoliviaBosnia and HerzegovinaBotswanaBrazilBulgariaBurkina FasoBurundiCabo VerdeCambodiaCameroonCanadaCaribbean small statesCentral African RepublicCentral Europe and the BalticsChadChileChinaColombiaComorosCongo, Dem. Rep.Congo, Rep.Costa RicaCote d'IvoireCroatiaCuracaoCyprusCzech RepublicDenmarkDjiboutiDominicaDominican RepublicEarly-demographic dividendEast Asia & PacificEast Asia & Pacific (excluding high income)East Asia & Pacific (IDA & IBRD countries)EcuadorEgypt, Arab Rep.El SalvadorEquatorial GuineaEstoniaEthiopiaEuro areaEurope & Central AsiaEurope & Central Asia (excluding high income)Europe & Central Asia (IDA & IBRD countries)European UnionFijiFinlandFragile and conflict affected situationsFranceFrench PolynesiaGabonGambia, TheGeorgiaGermanyGhanaGreeceGrenadaGuatemalaGuineaGuinea-BissauGuyanaHaitiHeavily indebted poor countries (HIPC)High incomeHondurasHong Kong SAR, ChinaHungaryIBRD onlyIcelandIDA & IBRD totalIDA blendIDA onlyIDA totalIndiaIndonesiaIran, Islamic Rep.IraqIrelandIsraelItalyJamaicaJapanJordanKazakhstanKenyaKiribatiKorea, Rep.KosovoKuwaitKyrgyz RepublicLao PDRLate-demographic dividendLatin America & Caribbean Latin America & Caribbean (excluding high income)Latin America & the Caribbean (IDA & IBRD countries)LatviaLeast developed countries: UN classificationLebanonLesothoLiberiaLibyaLithuaniaLow & middle incomeLow incomeLower middle incomeLuxembourgMacao SAR, ChinaMacedonia, FYRMadagascarMalawiMalaysiaMaldivesMaliMaltaMarshall IslandsMauritaniaMauritiusMexicoMiddle East & North AfricaMiddle East & North Africa (excluding high income)Middle East & North Africa (IDA & IBRD countries)Middle incomeMoldovaMongoliaMontenegroMoroccoMozambiqueMyanmarNamibiaNepalNetherlandsNew CaledoniaNew ZealandNicaraguaNigerNigeriaNorth AmericaNorwayOECD membersOmanOther small statesPacific island small statesPakistanPanamaPapua New GuineaParaguayPeruPhilippinesPolandPortugalPost-demographic dividendPre-demographic dividendQatarRomaniaRussian FederationRwandaSamoaSao Tome and PrincipeSaudi ArabiaSenegalSerbiaSeychellesSierra LeoneSingaporeSlovak RepublicSloveniaSmall statesSolomon IslandsSomaliaSouth AfricaSouth AsiaSouth Asia (IDA & IBRD)SpainSri LankaSt. Kitts and NevisSt. LuciaSt. Vincent and the GrenadinesSub-Saharan Africa Sub-Saharan Africa (excluding high income)Sub-Saharan Africa (IDA & IBRD countries)SudanSurinameSwazilandSwedenSwitzerlandSyrian Arab RepublicTajikistanTanzaniaThailandTimor-LesteTogoTongaTrinidad and TobagoTunisiaTurkeyUgandaUkraineUnited KingdomUnited StatesUpper middle incomeUruguayVanuatuVenezuela, RBVietnamWest Bank and GazaWorldYemen, Rep.ZambiaZimbabwe línea de tiempo (timeline):
En esta escala de tiempo se presenta un gráfico de 1961 y 2016 de Post-demographic dividend. Los datos de 1960 están ausentes. El número de observaciones reales por fecha: 56.
Fuente (nombre):
Indicadores del desarrollo mundial
Fuente (organización):
International Monetary Fund, Balance of Payments database, and World Bank, International Debt Statistics.
Categorías:
Economy & Growth, Financial Sector, External Debt
Se ha actualizado:
23 abr 2017 año
Los indicadores de los cambios de valor en los últimos años
Mínimo:
-126.392 bn
1 ene 2009 año
Máximo:
778.374 bn
1 ene 2015 año
A la fecha de observación
Valor
Cambio absoluto
El cambio con respecto al valor anterior
1 ene 1961 año
162.097 millones
+162.097 millones
0.0%
1 ene 1962 año
127.979 millones
-34.118 millones
-21.05%
1 ene 1963 año
-28.163 millones
-156.142 millones
-122.01%
1 ene 1964 año
-156.209 millones
-128.046 millones
454.67%
1 ene 1965 año
-83.905 millones
+72.304 millones
-46.29%
1 ene 1966 año
-112.998 millones
-29.093 millones
34.67%
1 ene 1967 año
111.228 millones
+224.226 millones
-198.43%
1 ene 1968 año
335.578 millones
+224.351 millones
201.7%
1 ene 1969 año
728.678 millones
+393.099 millones
117.14%
1 ene 1970 año
703.926 millones
-24.751 millones
-3.4%
1 ene 1971 año
1.363 bn
+658.601 millones
93.56%
1 ene 1972 año
2.255 bn
+892.134 millones
65.48%
1 ene 1973 año
4.707 bn
+2.453 bn
108.78%
1 ene 1974 año
2.69 bn
-2.017 bn
-42.85%
1 ene 1975 año
-390.859 millones
-3.081 bn
-114.53%
1 ene 1976 año
4.366 bn
+4.756 bn
-1.22 mil%
1 ene 1977 año
1.613 bn
-2.753 bn
-63.06%
1 ene 1978 año
2.038 bn
+425.612 millones
26.39%
1 ene 1979 año
2.163 bn
+124.936 millones
6.13%
1 ene 1980 año
4.343 bn
+2.18 bn
100.75%
1 ene 1981 año
15.331 bn
+10.988 bn
253.01%
1 ene 1982 año
12.949 bn
-2.382 bn
-15.53%
1 ene 1983 año
7.458 bn
-5.492 bn
-42.41%
1 ene 1984 año
20.198 bn
+12.741 bn
170.84%
1 ene 1985 año
135.4 millones
-20.063 bn
-99.33%
1 ene 1986 año
21.422 bn
+21.287 bn
15.72 mil%
1 ene 1987 año
35.155 bn
+13.732 bn
64.1%
1 ene 1988 año
8.638 bn
-26.517 bn
-75.43%
1 ene 1989 año
25.334 bn
+16.696 bn
193.29%
1 ene 1990 año
71.915 bn
+46.581 bn
183.87%
1 ene 1991 año
-14.958 bn
-86.873 bn
-120.8%
1 ene 1992 año
79.897 bn
+94.855 bn
-634.13%
1 ene 1993 año
37.008 bn
-42.889 bn
-53.68%
1 ene 1994 año
145.652 bn
+108.644 bn
293.57%
1 ene 1995 año
92.382 bn
-53.27 bn
-36.57%
1 ene 1996 año
105.532 bn
+13.151 bn
14.24%
1 ene 1997 año
145.425 bn
+39.893 bn
37.8%
1 ene 1998 año
167.935 bn
+22.51 bn
15.48%
1 ene 1999 año
268.18 bn
+100.246 bn
59.69%
1 ene 2000 año
541.85 bn
+273.67 bn
102.05%
1 ene 2001 año
569.73 bn
+27.88 bn
5.15%
1 ene 2002 año
320.544 bn
-249.186 bn
-43.74%
1 ene 2003 año
100.724 bn
-219.82 bn
-68.58%
1 ene 2004 año
330.083 bn
+229.359 bn
227.71%
1 ene 2005 año
384.618 bn
+54.535 bn
16.52%
1 ene 2006 año
748.636 bn
+364.018 bn
94.64%
1 ene 2007 año
650.503 bn
-98.134 bn
-13.11%
1 ene 2008 año
552.049 bn
-98.454 bn
-15.14%
1 ene 2009 año
-126.392 bn
-678.441 bn
-122.9%
1 ene 2010 año
716.751 bn
+843.143 bn
-667.09%
1 ene 2011 año
519.772 bn
-196.979 bn
-27.48%
1 ene 2012 año
187.918 bn
-331.854 bn
-63.85%
1 ene 2013 año
595.479 bn
+407.56 bn
216.88%
1 ene 2014 año
596.79 bn
+1.311 bn
0.22%
1 ene 2015 año
778.374 bn
+181.584 bn
30.43%
1 ene 2016 año
406.116 bn
-372.257 bn
-47.83%
Ranking de los países por los datos estadísticos actuales


Comentarios: