29
/es/
es
AIzaSyAYiBZKx7MnpbEhh9jyipgxe19OcubqV5w
April 1, 2024
37705
IDA & IBRD total
IBT
false
2
1
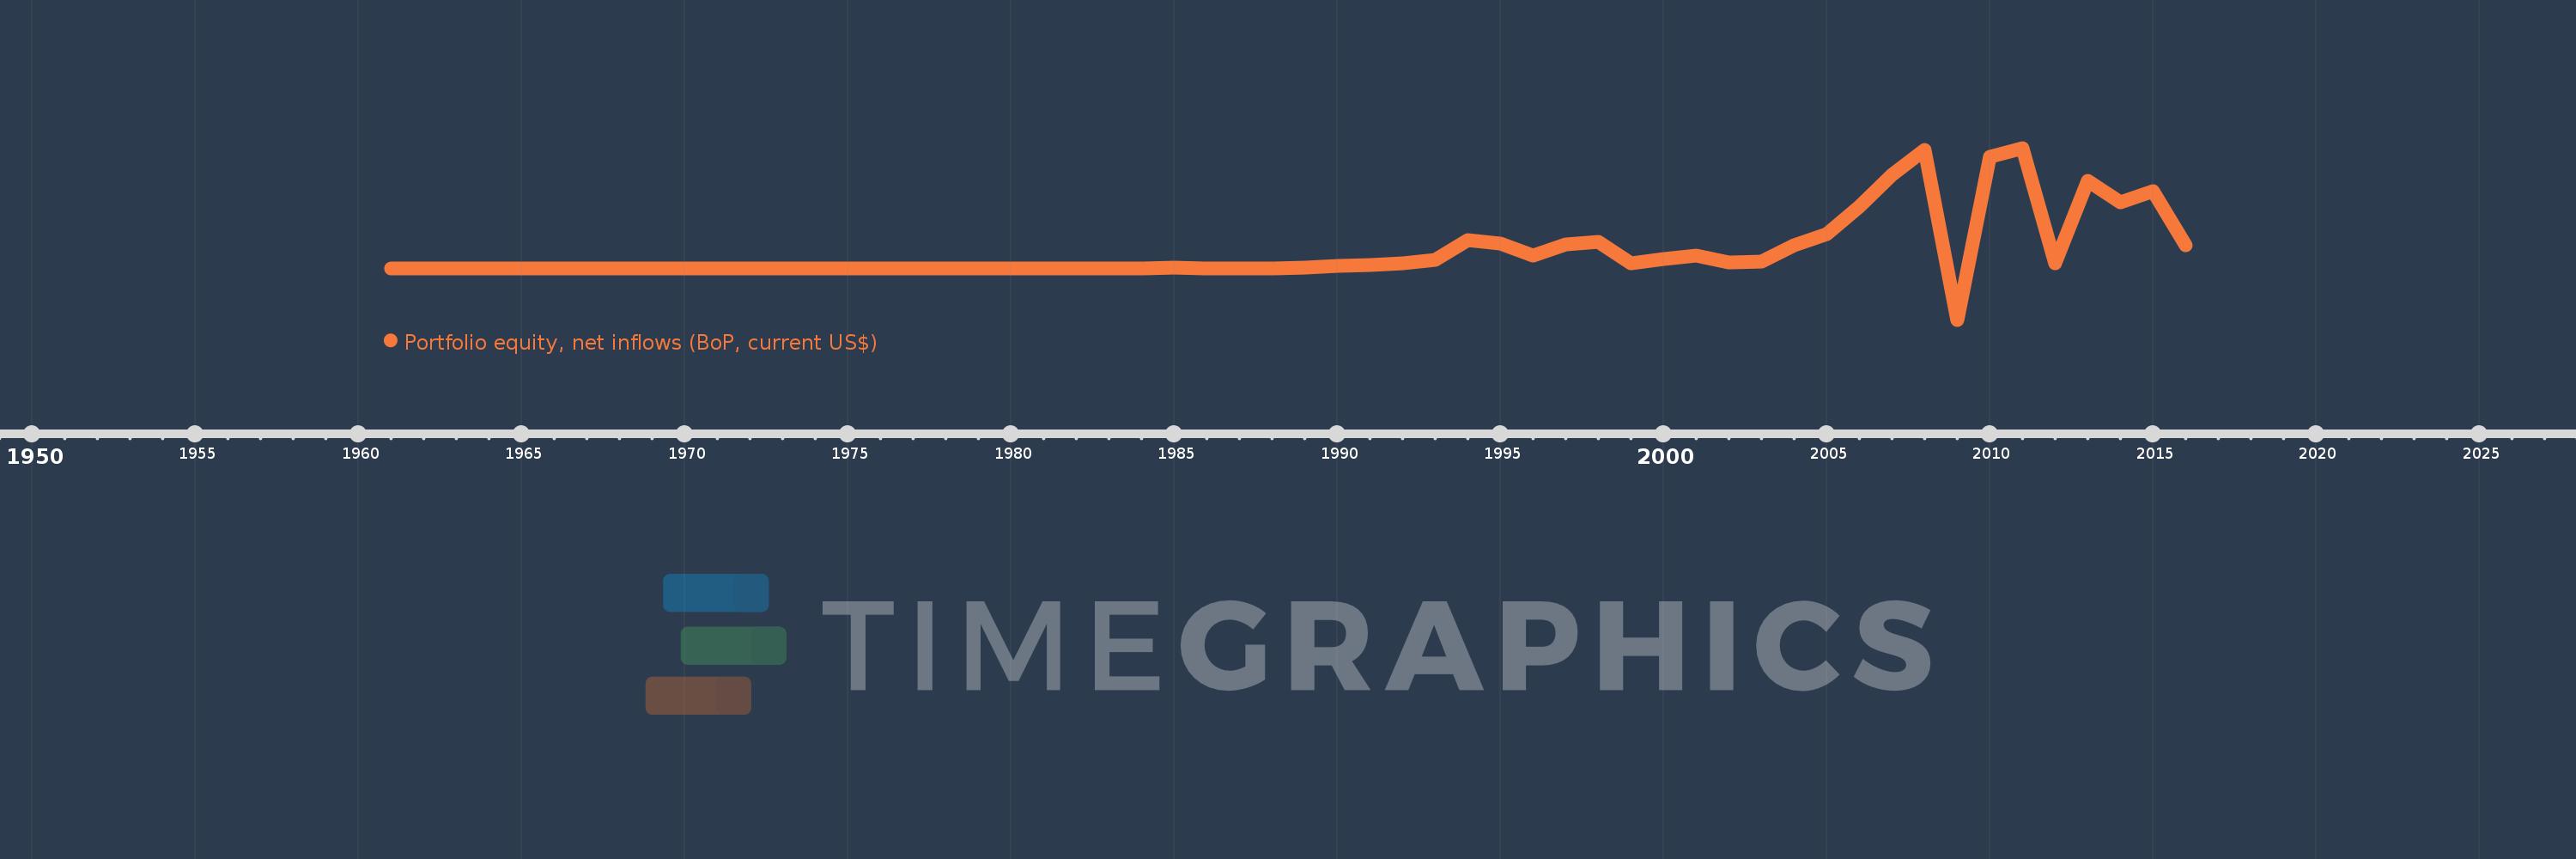
Portfolio equity, net inflows (BoP, current US$)
2016,2015,2014,2013,2012,2011,2010,2009,2008,2007,2006,2005,2004,2003,2002,2001,2000,1999,1998,1997,1996,1995,1994,1993,1992,1991,1990,1989,1988,1987,1986,1985,1984,1983,1982,1981,1980,1979,1978,1977,1976,1975,1974,1973,1972,1971,1970,1969,1968,1967,1966,1965,1964,1963,1962,1961
Estas estadísticas en otros países:
AfghanistanAlbaniaAlgeriaAngolaAntigua and BarbudaArab WorldArgentinaArmeniaArubaAustraliaAustriaAzerbaijanBahamas, TheBahrainBangladeshBarbadosBelarusBelgiumBelizeBeninBermudaBhutanBoliviaBosnia and HerzegovinaBotswanaBrazilBulgariaBurkina FasoBurundiCabo VerdeCambodiaCameroonCanadaCaribbean small statesCentral African RepublicCentral Europe and the BalticsChadChileChinaColombiaComorosCongo, Dem. Rep.Congo, Rep.Costa RicaCote d'IvoireCroatiaCuracaoCyprusCzech RepublicDenmarkDjiboutiDominicaDominican RepublicEarly-demographic dividendEast Asia & PacificEast Asia & Pacific (excluding high income)East Asia & Pacific (IDA & IBRD countries)EcuadorEgypt, Arab Rep.El SalvadorEquatorial GuineaEstoniaEthiopiaEuro areaEurope & Central AsiaEurope & Central Asia (excluding high income)Europe & Central Asia (IDA & IBRD countries)European UnionFijiFinlandFragile and conflict affected situationsFranceFrench PolynesiaGabonGambia, TheGeorgiaGermanyGhanaGreeceGrenadaGuatemalaGuineaGuinea-BissauGuyanaHaitiHeavily indebted poor countries (HIPC)High incomeHondurasHong Kong SAR, ChinaHungaryIBRD onlyIcelandIDA & IBRD totalIDA blendIDA onlyIDA totalIndiaIndonesiaIran, Islamic Rep.IraqIrelandIsraelItalyJamaicaJapanJordanKazakhstanKenyaKiribatiKorea, Rep.KosovoKuwaitKyrgyz RepublicLao PDRLate-demographic dividendLatin America & Caribbean Latin America & Caribbean (excluding high income)Latin America & the Caribbean (IDA & IBRD countries)LatviaLeast developed countries: UN classificationLebanonLesothoLiberiaLibyaLithuaniaLow & middle incomeLow incomeLower middle incomeLuxembourgMacao SAR, ChinaMacedonia, FYRMadagascarMalawiMalaysiaMaldivesMaliMaltaMarshall IslandsMauritaniaMauritiusMexicoMiddle East & North AfricaMiddle East & North Africa (excluding high income)Middle East & North Africa (IDA & IBRD countries)Middle incomeMoldovaMongoliaMontenegroMoroccoMozambiqueMyanmarNamibiaNepalNetherlandsNew CaledoniaNew ZealandNicaraguaNigerNigeriaNorth AmericaNorwayOECD membersOmanOther small statesPacific island small statesPakistanPanamaPapua New GuineaParaguayPeruPhilippinesPolandPortugalPost-demographic dividendPre-demographic dividendQatarRomaniaRussian FederationRwandaSamoaSao Tome and PrincipeSaudi ArabiaSenegalSerbiaSeychellesSierra LeoneSingaporeSlovak RepublicSloveniaSmall statesSolomon IslandsSomaliaSouth AfricaSouth AsiaSouth Asia (IDA & IBRD)SpainSri LankaSt. Kitts and NevisSt. LuciaSt. Vincent and the GrenadinesSub-Saharan Africa Sub-Saharan Africa (excluding high income)Sub-Saharan Africa (IDA & IBRD countries)SudanSurinameSwazilandSwedenSwitzerlandSyrian Arab RepublicTajikistanTanzaniaThailandTimor-LesteTogoTongaTrinidad and TobagoTunisiaTurkeyUgandaUkraineUnited KingdomUnited StatesUpper middle incomeUruguayVanuatuVenezuela, RBVietnamWest Bank and GazaWorldYemen, Rep.ZambiaZimbabwe línea de tiempo (timeline):
En esta escala de tiempo se presenta un gráfico de 1961 y 2016 de IDA & IBRD total. Los datos de 1960 están ausentes. El número de observaciones reales por fecha: 56.
Fuente (nombre):
Indicadores del desarrollo mundial
Fuente (organización):
International Monetary Fund, Balance of Payments database, and World Bank, International Debt Statistics.
Categorías:
Economy & Growth, Financial Sector, External Debt
Se ha actualizado:
23 abr 2017 año
Los indicadores de los cambios de valor en los últimos años
Mínimo:
-58.157 bn
1 ene 2009 año
Máximo:
135.538 bn
1 ene 2011 año
A la fecha de observación
Valor
Cambio absoluto
El cambio con respecto al valor anterior
1 ene 1961 año
0.0
0.0
0.0%
1 ene 1975 año
3.756 millones
+3.756 millones
%
1 ene 1976 año
6.702 millones
+2.946 millones
78.45%
1 ene 1977 año
39.536 millones
+32.834 millones
489.92%
1 ene 1978 año
1.331 millones
-38.205 millones
-96.63%
1 ene 1979 año
41.85 millones
+40.519 millones
3.04 mil%
1 ene 1980 año
20.348 millones
-21.502 millones
-51.38%
1 ene 1981 año
60.732 millones
+40.384 millones
198.47%
1 ene 1982 año
111.36 millones
+50.628 millones
83.36%
1 ene 1983 año
105.568 millones
-5.792 millones
-5.2%
1 ene 1984 año
78.999 millones
-26.569 millones
-25.17%
1 ene 1985 año
145.266 millones
+66.267 millones
83.88%
1 ene 1986 año
-78.359 millones
-223.625 millones
-153.94%
1 ene 1987 año
-453.537 millones
-375.178 millones
478.79%
1 ene 1988 año
-2.514 millones
+451.023 millones
-99.45%
1 ene 1989 año
390.449 millones
+392.963 millones
-15.63 mil%
1 ene 1990 año
2.437 bn
+2.047 bn
524.16%
1 ene 1991 año
3.39 bn
+953.319 millones
39.12%
1 ene 1992 año
5.756 bn
+2.366 bn
69.77%
1 ene 1993 año
9.409 bn
+3.653 bn
63.46%
1 ene 1994 año
31.639 bn
+22.23 bn
236.27%
1 ene 1995 año
28.213 bn
-3.426 bn
-10.83%
1 ene 1996 año
14.058 bn
-14.155 bn
-50.17%
1 ene 1997 año
27.008 bn
+12.949 bn
92.11%
1 ene 1998 año
29.842 bn
+2.835 bn
10.5%
1 ene 1999 año
5.022 bn
-24.82 bn
-83.17%
1 ene 2000 año
10.123 bn
+5.101 bn
101.57%
1 ene 2001 año
14.315 bn
+4.192 bn
41.41%
1 ene 2002 año
6.436 bn
-7.879 bn
-55.04%
1 ene 2003 año
7.781 bn
+1.346 bn
20.91%
1 ene 2004 año
25.481 bn
+17.7 bn
227.48%
1 ene 2005 año
38.74 bn
+13.259 bn
52.03%
1 ene 2006 año
69.089 bn
+30.349 bn
78.34%
1 ene 2007 año
105.679 bn
+36.59 bn
52.96%
1 ene 2008 año
133.596 bn
+27.918 bn
26.42%
1 ene 2009 año
-58.157 bn
-191.753 bn
-143.53%
1 ene 2010 año
125.651 bn
+183.808 bn
-316.06%
1 ene 2011 año
135.538 bn
+9.887 bn
7.87%
1 ene 2012 año
5.648 bn
-129.89 bn
-95.83%
1 ene 2013 año
98.687 bn
+93.039 bn
1.65 mil%
1 ene 2014 año
73.781 bn
-24.906 bn
-25.24%
1 ene 2015 año
86.565 bn
+12.784 bn
17.33%
1 ene 2016 año
25.336 bn
-61.23 bn
-70.73%
Ranking de los países por los datos estadísticos actuales


Comentarios: