29
/es/
es
AIzaSyAYiBZKx7MnpbEhh9jyipgxe19OcubqV5w
April 1, 2024
55005
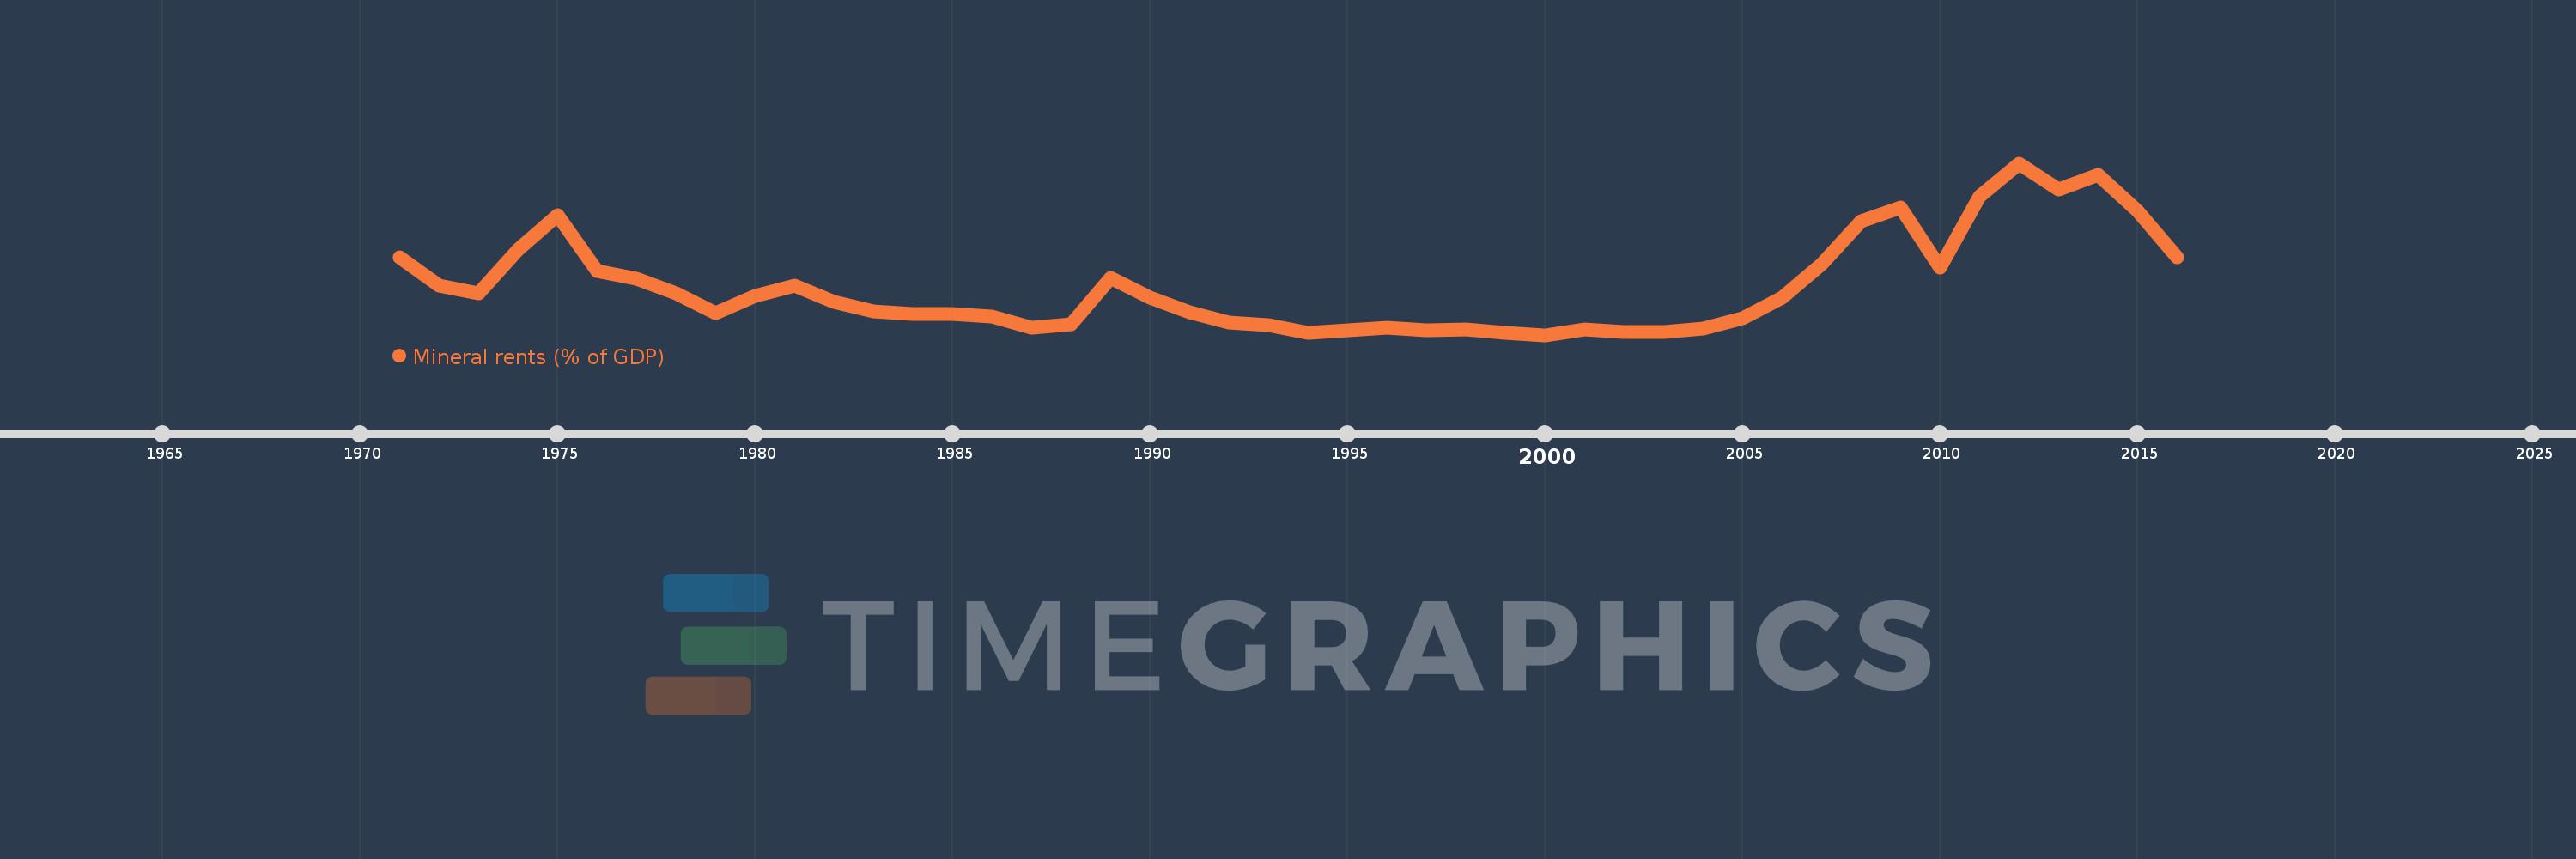
Post-demographic dividend
PST
false
2
1
Mineral rents (% of GDP)
2016,2015,2014,2013,2012,2011,2010,2009,2008,2007,2006,2005,2004,2003,2002,2001,2000,1999,1998,1997,1996,1995,1994,1993,1992,1991,1990,1989,1988,1987,1986,1985,1984,1983,1982,1981,1980,1979,1978,1977,1976,1975,1974,1973,1972,1971
Estas estadísticas en otros países:
AfghanistanAlbaniaAlgeriaAndorraAngolaAntigua and BarbudaArab WorldArgentinaArmeniaArubaAustraliaAustriaAzerbaijanBahamas, TheBahrainBangladeshBarbadosBelarusBelgiumBelizeBeninBermudaBhutanBoliviaBosnia and HerzegovinaBotswanaBrazilBrunei DarussalamBulgariaBurkina FasoBurundiCabo VerdeCambodiaCameroonCanadaCaribbean small statesCayman IslandsCentral African RepublicCentral Europe and the BalticsChadChannel IslandsChileChinaColombiaComorosCongo, Dem. Rep.Congo, Rep.Costa RicaCote d'IvoireCroatiaCubaCyprusCzech RepublicDenmarkDjiboutiDominicaDominican RepublicEarly-demographic dividendEast Asia & PacificEast Asia & Pacific (excluding high income)East Asia & Pacific (IDA & IBRD countries)EcuadorEgypt, Arab Rep.El SalvadorEquatorial GuineaEritreaEstoniaEthiopiaEuro areaEurope & Central AsiaEurope & Central Asia (excluding high income)Europe & Central Asia (IDA & IBRD countries)European UnionFaroe IslandsFijiFinlandFragile and conflict affected situationsFranceFrench PolynesiaGabonGambia, TheGeorgiaGermanyGhanaGreeceGreenlandGrenadaGuatemalaGuineaGuinea-BissauGuyanaHaitiHeavily indebted poor countries (HIPC)High incomeHondurasHong Kong SAR, ChinaHungaryIBRD onlyIcelandIDA & IBRD totalIDA blendIDA onlyIDA totalIndiaIndonesiaIran, Islamic Rep.IraqIrelandIsle of ManIsraelItalyJamaicaJapanJordanKazakhstanKenyaKiribatiKorea, Rep.KosovoKuwaitKyrgyz RepublicLao PDRLate-demographic dividendLatin America & Caribbean Latin America & Caribbean (excluding high income)Latin America & the Caribbean (IDA & IBRD countries)LatviaLeast developed countries: UN classificationLebanonLesothoLiberiaLibyaLiechtensteinLithuaniaLow & middle incomeLow incomeLower middle incomeLuxembourgMacao SAR, ChinaMacedonia, FYRMadagascarMalawiMalaysiaMaldivesMaliMaltaMarshall IslandsMauritaniaMauritiusMexicoMicronesia, Fed. Sts.Middle East & North AfricaMiddle East & North Africa (excluding high income)Middle East & North Africa (IDA & IBRD countries)Middle incomeMoldovaMonacoMongoliaMontenegroMoroccoMozambiqueMyanmarNamibiaNepalNetherlandsNew CaledoniaNew ZealandNicaraguaNigerNigeriaNorth AmericaNorwayOECD membersOmanOther small statesPacific island small statesPakistanPalauPanamaPapua New GuineaParaguayPeruPhilippinesPolandPortugalPost-demographic dividendPre-demographic dividendPuerto RicoQatarRomaniaRussian FederationRwandaSamoaSan MarinoSao Tome and PrincipeSaudi ArabiaSenegalSerbiaSeychellesSierra LeoneSingaporeSlovak RepublicSloveniaSmall statesSolomon IslandsSomaliaSouth AfricaSouth AsiaSouth Asia (IDA & IBRD)South SudanSpainSri LankaSt. Kitts and NevisSt. LuciaSt. Vincent and the GrenadinesSub-Saharan Africa Sub-Saharan Africa (excluding high income)Sub-Saharan Africa (IDA & IBRD countries)SudanSurinameSwazilandSwedenSwitzerlandSyrian Arab RepublicTajikistanTanzaniaThailandTimor-LesteTogoTongaTrinidad and TobagoTunisiaTurkeyTurkmenistanTuvaluUgandaUkraineUnited Arab EmiratesUnited KingdomUnited StatesUpper middle incomeUruguayUzbekistanVanuatuVenezuela, RBVietnamVirgin Islands (U.S.)West Bank and GazaWorldYemen, Rep.ZambiaZimbabwe línea de tiempo (timeline):
En esta escala de tiempo se presenta un gráfico de 1971 y 2016 de Post-demographic dividend. Los datos de 1970 están ausentes. El número de observaciones reales por fecha: 46.
Fuente (nombre):
Indicadores del desarrollo mundial
Fuente (organización):
Estimates based on sources and methods described in "The Changing Wealth of Nations: Measuring Sustainable Development in the New Millennium" (World Bank, 2011).
Categorías:
Energy & Mining, Environment
Se ha actualizado:
23 abr 2017 año
Los indicadores de los cambios de valor en los últimos años
Mínimo:
0.023
1 ene 2000 año
Máximo:
0.362
1 ene 2012 año
A la fecha de observación
Valor
Cambio absoluto
El cambio con respecto al valor anterior
1 ene 1971 año
0.177
+0.177
0.0%
1 ene 1972 año
0.12
-0.057
-32.27%
1 ene 1973 año
0.106
-0.013
-11.04%
1 ene 1974 año
0.191
+0.084
79.29%
1 ene 1975 año
0.259
+0.068
35.8%
1 ene 1976 año
0.149
-0.11
-42.53%
1 ene 1977 año
0.134
-0.015
-9.82%
1 ene 1978 año
0.106
-0.028
-20.72%
1 ene 1979 año
0.067
-0.039
-36.83%
1 ene 1980 año
0.1
+0.033
48.35%
1 ene 1981 año
0.121
+0.022
21.66%
1 ene 1982 año
0.088
-0.034
-27.61%
1 ene 1983 año
0.069
-0.019
-21.59%
1 ene 1984 año
0.065
-0.004
-5.81%
1 ene 1985 año
0.064
-0.001
-1.37%
1 ene 1986 año
0.059
-0.005
-8.27%
1 ene 1987 año
0.038
-0.021
-36.1%
1 ene 1988 año
0.044
+0.007
18.21%
1 ene 1989 año
0.136
+0.091
205.55%
1 ene 1990 año
0.096
-0.039
-29.0%
1 ene 1991 año
0.068
-0.028
-29.48%
1 ene 1992 año
0.048
-0.02
-29.02%
1 ene 1993 año
0.042
-0.006
-12.31%
1 ene 1994 año
0.027
-0.016
-36.94%
1 ene 1995 año
0.033
+0.006
24.0%
1 ene 1996 año
0.037
+0.004
12.66%
1 ene 1997 año
0.033
-0.005
-12.18%
1 ene 1998 año
0.034
+0.001
2.97%
1 ene 1999 año
0.027
-0.006
-18.54%
1 ene 2000 año
0.023
-0.004
-14.71%
1 ene 2001 año
0.034
+0.01
44.46%
1 ene 2002 año
0.029
-0.005
-15.37%
1 ene 2003 año
0.029
+0.001
2.81%
1 ene 2004 año
0.035
+0.006
18.75%
1 ene 2005 año
0.056
+0.022
61.93%
1 ene 2006 año
0.097
+0.041
72.56%
1 ene 2007 año
0.162
+0.064
66.03%
1 ene 2008 año
0.247
+0.085
52.58%
1 ene 2009 año
0.275
+0.028
11.48%
1 ene 2010 año
0.156
-0.119
-43.15%
1 ene 2011 año
0.296
+0.14
89.39%
1 ene 2012 año
0.362
+0.065
21.99%
1 ene 2013 año
0.31
-0.051
-14.21%
1 ene 2014 año
0.339
+0.029
9.24%
1 ene 2015 año
0.268
-0.071
-20.89%
1 ene 2016 año
0.176
-0.092
-34.37%
Ranking de los países por los datos estadísticos actuales


Comentarios: