29
/es/
es
AIzaSyAYiBZKx7MnpbEhh9jyipgxe19OcubqV5w
April 1, 2024
236073
Senegal
SEN
true
2
1
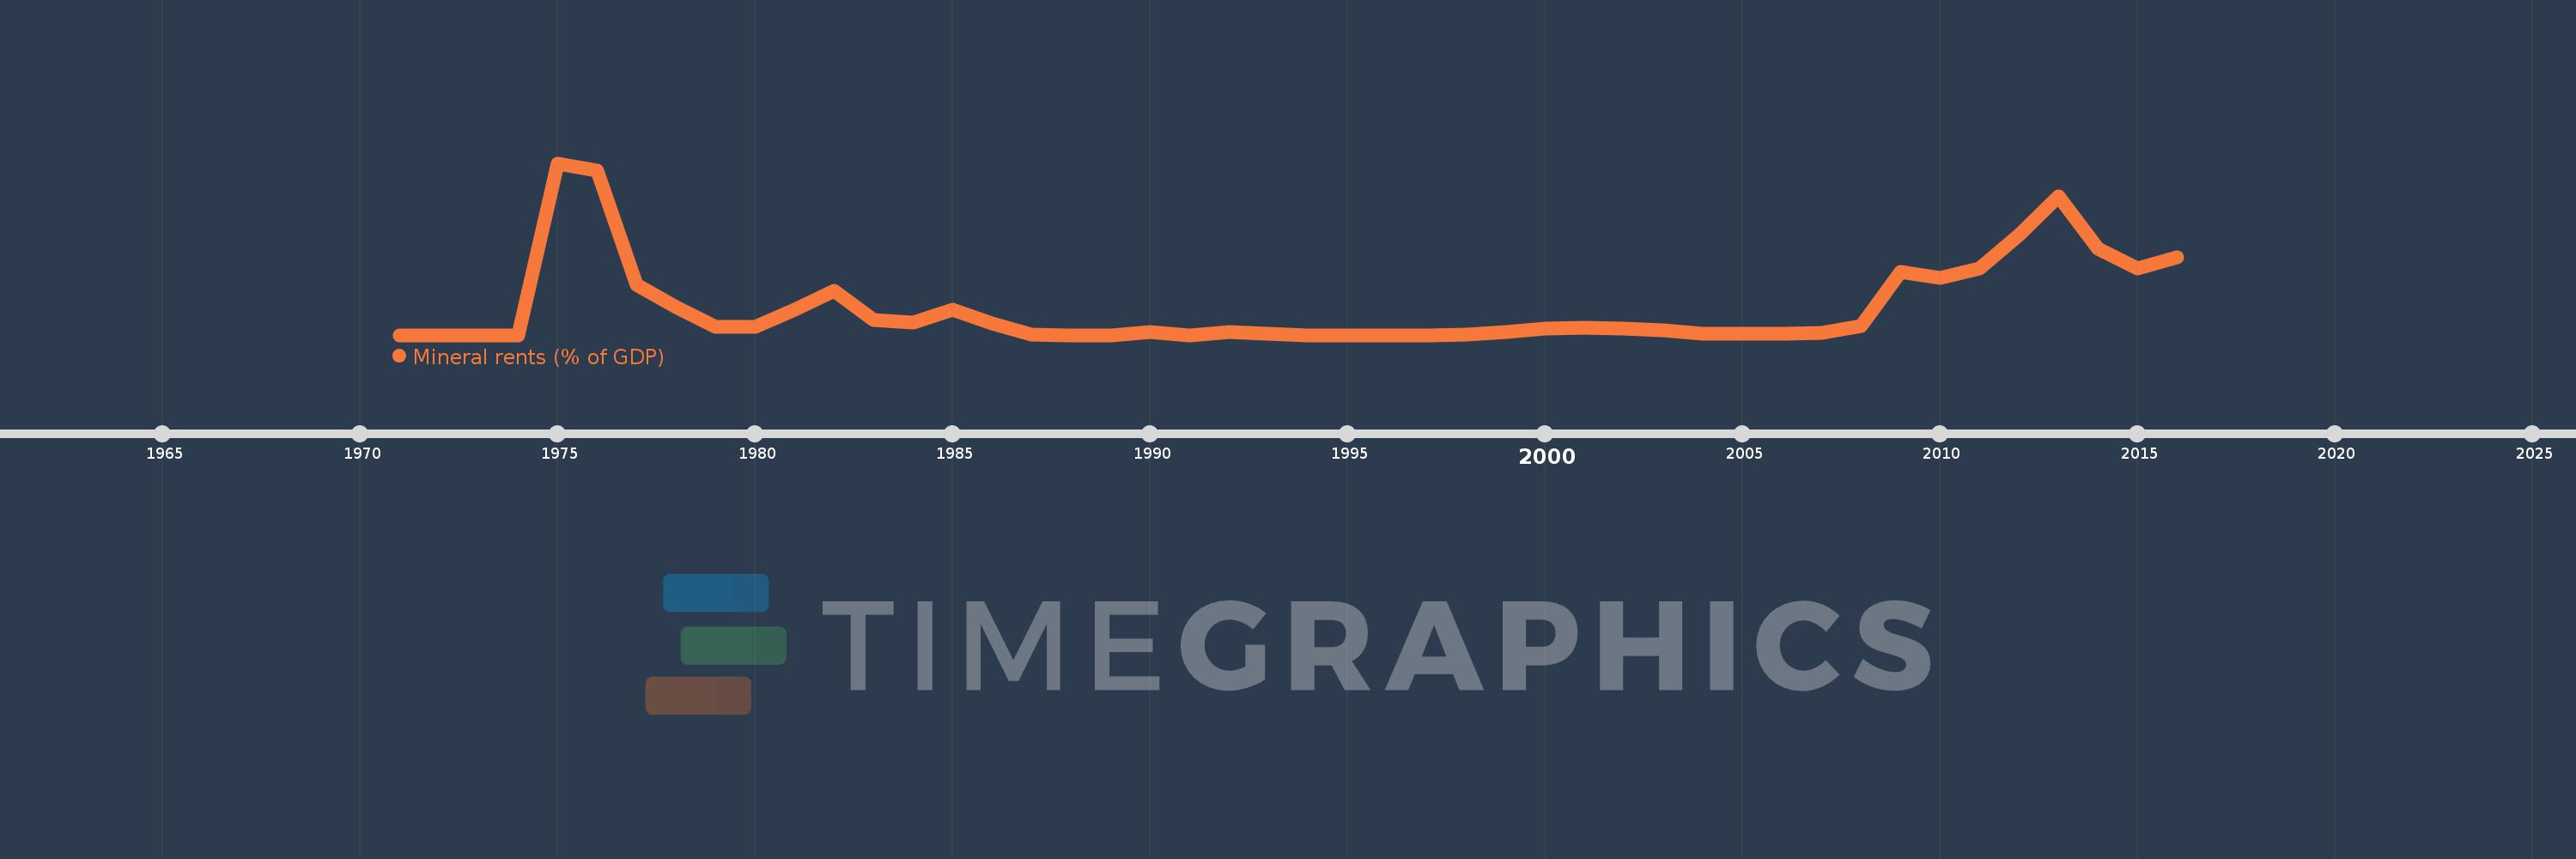
Mineral rents (% of GDP)
2016,2015,2014,2013,2012,2011,2010,2009,2008,2007,2006,2005,2004,2003,2002,2001,2000,1999,1998,1997,1996,1995,1994,1993,1992,1991,1990,1989,1988,1987,1986,1985,1984,1983,1982,1981,1980,1979,1978,1977,1976,1975,1974,1973,1972,1971
Estas estadísticas en otros países:
AfghanistanAlbaniaAlgeriaAndorraAngolaAntigua and BarbudaArab WorldArgentinaArmeniaArubaAustraliaAustriaAzerbaijanBahamas, TheBahrainBangladeshBarbadosBelarusBelgiumBelizeBeninBermudaBhutanBoliviaBosnia and HerzegovinaBotswanaBrazilBrunei DarussalamBulgariaBurkina FasoBurundiCabo VerdeCambodiaCameroonCanadaCaribbean small statesCayman IslandsCentral African RepublicCentral Europe and the BalticsChadChannel IslandsChileChinaColombiaComorosCongo, Dem. Rep.Congo, Rep.Costa RicaCote d'IvoireCroatiaCubaCyprusCzech RepublicDenmarkDjiboutiDominicaDominican RepublicEarly-demographic dividendEast Asia & PacificEast Asia & Pacific (excluding high income)East Asia & Pacific (IDA & IBRD countries)EcuadorEgypt, Arab Rep.El SalvadorEquatorial GuineaEritreaEstoniaEthiopiaEuro areaEurope & Central AsiaEurope & Central Asia (excluding high income)Europe & Central Asia (IDA & IBRD countries)European UnionFaroe IslandsFijiFinlandFragile and conflict affected situationsFranceFrench PolynesiaGabonGambia, TheGeorgiaGermanyGhanaGreeceGreenlandGrenadaGuatemalaGuineaGuinea-BissauGuyanaHaitiHeavily indebted poor countries (HIPC)High incomeHondurasHong Kong SAR, ChinaHungaryIBRD onlyIcelandIDA & IBRD totalIDA blendIDA onlyIDA totalIndiaIndonesiaIran, Islamic Rep.IraqIrelandIsle of ManIsraelItalyJamaicaJapanJordanKazakhstanKenyaKiribatiKorea, Rep.KosovoKuwaitKyrgyz RepublicLao PDRLate-demographic dividendLatin America & Caribbean Latin America & Caribbean (excluding high income)Latin America & the Caribbean (IDA & IBRD countries)LatviaLeast developed countries: UN classificationLebanonLesothoLiberiaLibyaLiechtensteinLithuaniaLow & middle incomeLow incomeLower middle incomeLuxembourgMacao SAR, ChinaMacedonia, FYRMadagascarMalawiMalaysiaMaldivesMaliMaltaMarshall IslandsMauritaniaMauritiusMexicoMicronesia, Fed. Sts.Middle East & North AfricaMiddle East & North Africa (excluding high income)Middle East & North Africa (IDA & IBRD countries)Middle incomeMoldovaMonacoMongoliaMontenegroMoroccoMozambiqueMyanmarNamibiaNepalNetherlandsNew CaledoniaNew ZealandNicaraguaNigerNigeriaNorth AmericaNorwayOECD membersOmanOther small statesPacific island small statesPakistanPalauPanamaPapua New GuineaParaguayPeruPhilippinesPolandPortugalPost-demographic dividendPre-demographic dividendPuerto RicoQatarRomaniaRussian FederationRwandaSamoaSan MarinoSao Tome and PrincipeSaudi ArabiaSenegalSerbiaSeychellesSierra LeoneSingaporeSlovak RepublicSloveniaSmall statesSolomon IslandsSomaliaSouth AfricaSouth AsiaSouth Asia (IDA & IBRD)South SudanSpainSri LankaSt. Kitts and NevisSt. LuciaSt. Vincent and the GrenadinesSub-Saharan Africa Sub-Saharan Africa (excluding high income)Sub-Saharan Africa (IDA & IBRD countries)SudanSurinameSwazilandSwedenSwitzerlandSyrian Arab RepublicTajikistanTanzaniaThailandTimor-LesteTogoTongaTrinidad and TobagoTunisiaTurkeyTurkmenistanTuvaluUgandaUkraineUnited Arab EmiratesUnited KingdomUnited StatesUpper middle incomeUruguayUzbekistanVanuatuVenezuela, RBVietnamVirgin Islands (U.S.)West Bank and GazaWorldYemen, Rep.ZambiaZimbabwe línea de tiempo (timeline):
En esta escala de tiempo se presenta un gráfico de 1971 y 2016 de Senegal. Los datos de 1970 están ausentes. El número de observaciones reales por fecha: 46.
Fuente (nombre):
Indicadores del desarrollo mundial
Fuente (organización):
Estimates based on sources and methods described in "The Changing Wealth of Nations: Measuring Sustainable Development in the New Millennium" (World Bank, 2011).
Categorías:
Energy & Mining, Environment
Se ha actualizado:
23 abr 2017 año
Los indicadores de los cambios de valor en los últimos años
Máximo:
4.075
1 ene 1975 año
A la fecha de observación
Valor
Cambio absoluto
El cambio con respecto al valor anterior
1 ene 1971 año
0.0
0.0
0.0%
1 ene 1975 año
4.075
+4.075
%
1 ene 1976 año
3.898
-0.177
-4.35%
1 ene 1977 año
1.187
-2.71
-69.53%
1 ene 1978 año
0.656
-0.532
-44.79%
1 ene 1979 año
0.192
-0.464
-70.78%
1 ene 1980 año
0.19
-0.001
-0.69%
1 ene 1981 año
0.607
+0.417
219.36%
1 ene 1982 año
1.052
+0.444
73.15%
1 ene 1983 año
0.35
-0.701
-66.69%
1 ene 1984 año
0.295
-0.056
-15.88%
1 ene 1985 año
0.603
+0.309
104.7%
1 ene 1986 año
0.272
-0.332
-54.95%
1 ene 1987 año
0.018
-0.253
-93.23%
1 ene 1988 año
0.0
-0.018
-100.0%
1 ene 1990 año
0.074
+0.074
%
1 ene 1991 año
0.0
-0.074
-100.0%
1 ene 1992 año
0.067
+0.067
%
1 ene 1993 año
0.025
-0.042
-62.87%
1 ene 1994 año
0.0
-0.025
-100.0%
1 ene 1998 año
0.013
+0.013
%
1 ene 1999 año
0.078
+0.065
512.1%
1 ene 2000 año
0.152
+0.074
95.61%
1 ene 2001 año
0.171
+0.019
12.48%
1 ene 2002 año
0.144
-0.027
-15.73%
1 ene 2003 año
0.106
-0.038
-26.27%
1 ene 2004 año
0.023
-0.084
-78.69%
1 ene 2005 año
0.028
+0.005
21.8%
1 ene 2006 año
0.031
+0.004
13.46%
1 ene 2007 año
0.06
+0.029
93.12%
1 ene 2008 año
0.209
+0.149
246.41%
1 ene 2009 año
1.497
+1.287
615.7%
1 ene 2010 año
1.364
-0.133
-8.86%
1 ene 2011 año
1.574
+0.21
15.42%
1 ene 2012 año
2.382
+0.808
51.31%
1 ene 2013 año
3.284
+0.902
37.85%
1 ene 2014 año
2.044
-1.24
-37.75%
1 ene 2015 año
1.588
-0.456
-22.33%
1 ene 2016 año
1.845
+0.257
16.19%
Ranking de los países por los datos estadísticos actuales


Comentarios: