29
/es/
es
AIzaSyAYiBZKx7MnpbEhh9jyipgxe19OcubqV5w
April 1, 2024
54865
Post-demographic dividend
PST
false
2
1
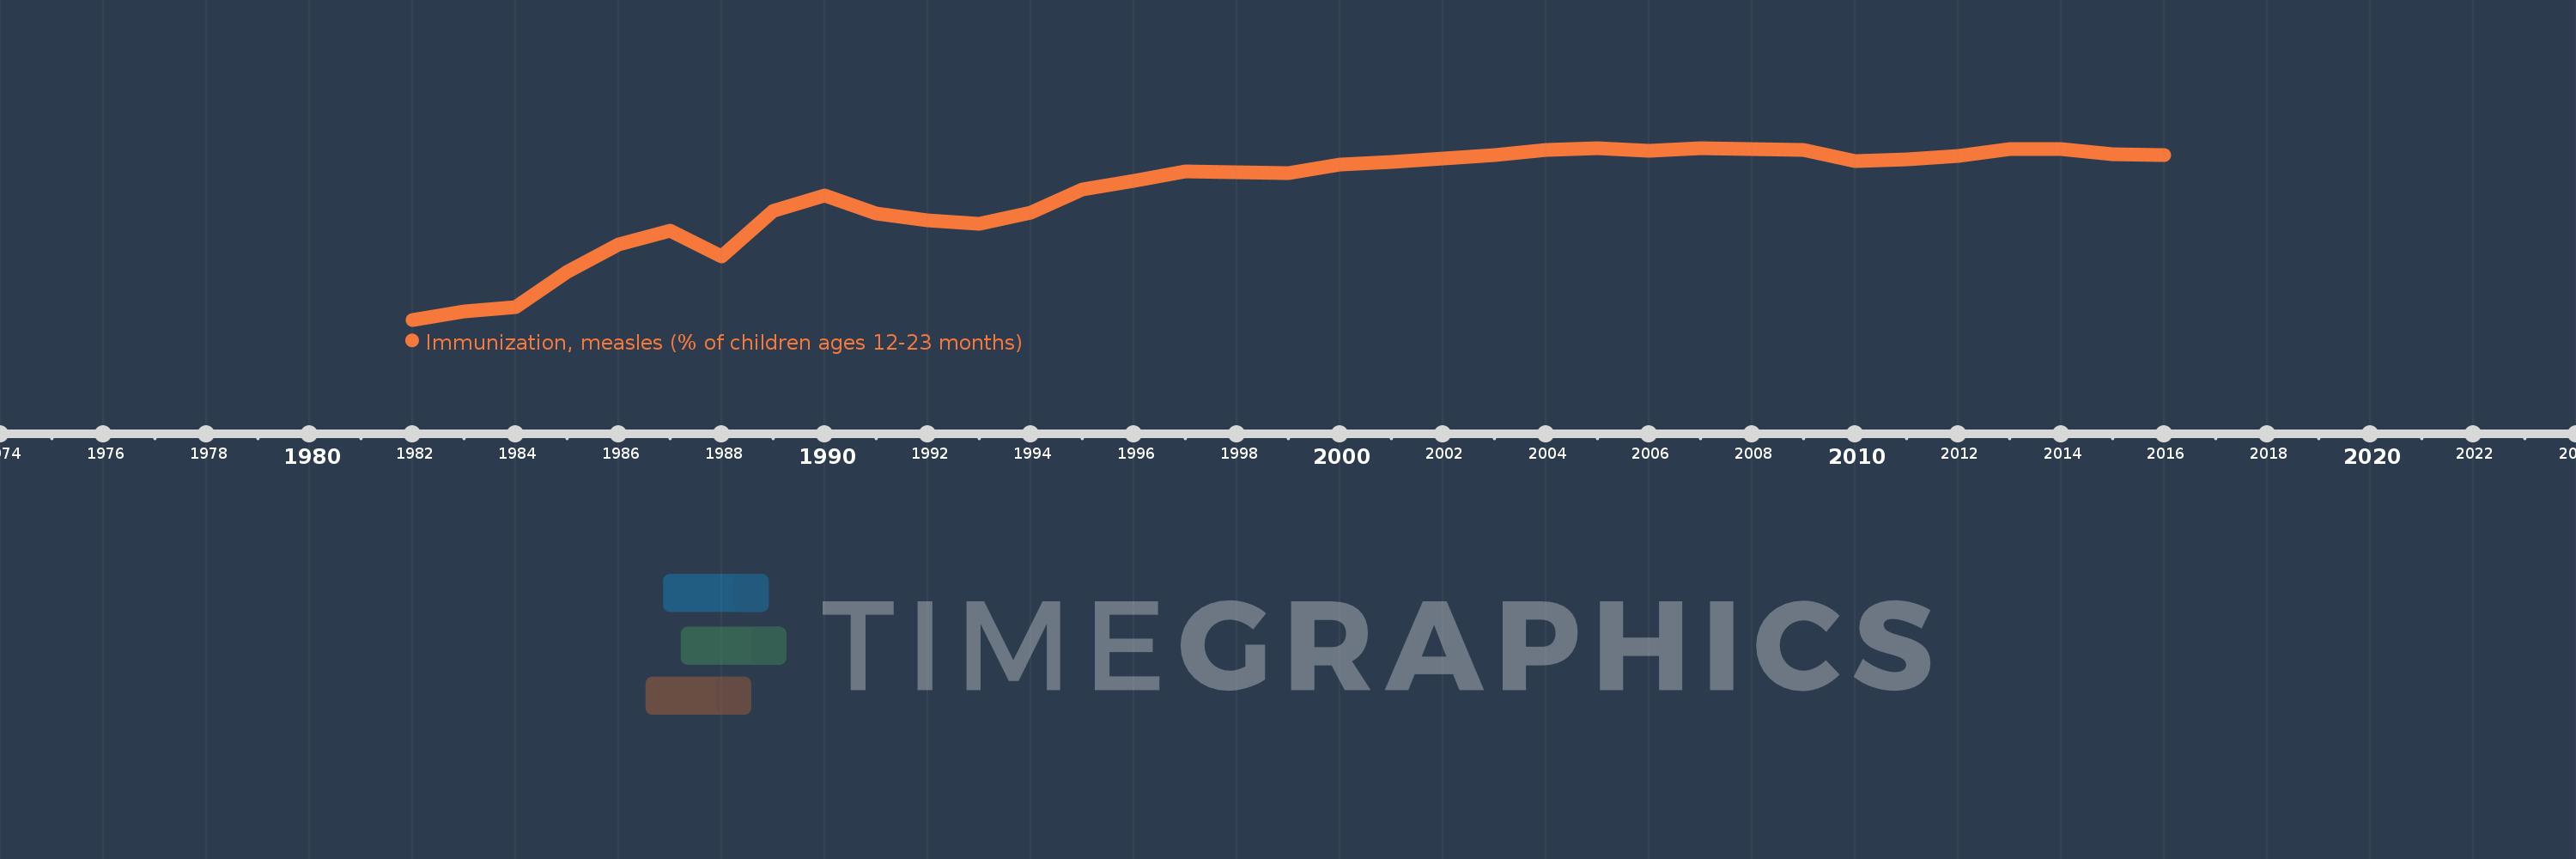
Immunization, measles (% of children ages 12-23 months)
2016,2015,2014,2013,2012,2011,2010,2009,2008,2007,2006,2005,2004,2003,2002,2001,2000,1999,1998,1997,1996,1995,1994,1993,1992,1991,1990,1989,1988,1987,1986,1985,1984,1983,1982
Estas estadísticas en otros países:
AfghanistanAlbaniaAlgeriaAndorraAngolaAntigua and BarbudaArab WorldArgentinaArmeniaAustraliaAustriaAzerbaijanBahamas, TheBahrainBangladeshBarbadosBelarusBelgiumBelizeBeninBhutanBoliviaBosnia and HerzegovinaBotswanaBrazilBrunei DarussalamBulgariaBurkina FasoBurundiCabo VerdeCambodiaCameroonCanadaCaribbean small statesCentral African RepublicCentral Europe and the BalticsChadChileChinaColombiaComorosCongo, Dem. Rep.Congo, Rep.Costa RicaCote d'IvoireCroatiaCubaCyprusCzech RepublicDenmarkDjiboutiDominicaDominican RepublicEarly-demographic dividendEast Asia & PacificEast Asia & Pacific (excluding high income)East Asia & Pacific (IDA & IBRD countries)EcuadorEgypt, Arab Rep.El SalvadorEquatorial GuineaEritreaEstoniaEthiopiaEuro areaEurope & Central AsiaEurope & Central Asia (excluding high income)Europe & Central Asia (IDA & IBRD countries)European UnionFijiFinlandFragile and conflict affected situationsFranceGabonGambia, TheGeorgiaGermanyGhanaGreeceGrenadaGuatemalaGuineaGuinea-BissauGuyanaHaitiHeavily indebted poor countries (HIPC)High incomeHondurasHungaryIBRD onlyIcelandIDA & IBRD totalIDA blendIDA onlyIDA totalIndiaIndonesiaIran, Islamic Rep.IraqIrelandIsraelItalyJamaicaJapanJordanKazakhstanKenyaKiribatiKorea, Dem. People’s Rep.Korea, Rep.KuwaitKyrgyz RepublicLao PDRLate-demographic dividendLatin America & Caribbean Latin America & Caribbean (excluding high income)Latin America & the Caribbean (IDA & IBRD countries)LatviaLeast developed countries: UN classificationLebanonLesothoLiberiaLibyaLithuaniaLow & middle incomeLow incomeLower middle incomeLuxembourgMacedonia, FYRMadagascarMalawiMalaysiaMaldivesMaliMaltaMarshall IslandsMauritaniaMauritiusMexicoMicronesia, Fed. Sts.Middle East & North AfricaMiddle East & North Africa (excluding high income)Middle East & North Africa (IDA & IBRD countries)Middle incomeMoldovaMonacoMongoliaMontenegroMoroccoMozambiqueMyanmarNamibiaNauruNepalNetherlandsNew ZealandNicaraguaNigerNigeriaNorth AmericaNorwayOECD membersOmanOther small statesPacific island small statesPakistanPalauPanamaPapua New GuineaParaguayPeruPhilippinesPolandPortugalPost-demographic dividendPre-demographic dividendQatarRomaniaRussian FederationRwandaSamoaSan MarinoSao Tome and PrincipeSaudi ArabiaSenegalSerbiaSeychellesSierra LeoneSingaporeSlovak RepublicSloveniaSmall statesSolomon IslandsSomaliaSouth AfricaSouth AsiaSouth Asia (IDA & IBRD)South SudanSpainSri LankaSt. Kitts and NevisSt. LuciaSt. Vincent and the GrenadinesSub-Saharan Africa Sub-Saharan Africa (excluding high income)Sub-Saharan Africa (IDA & IBRD countries)SudanSurinameSwazilandSwedenSwitzerlandSyrian Arab RepublicTajikistanTanzaniaThailandTimor-LesteTogoTongaTrinidad and TobagoTunisiaTurkeyTurkmenistanTuvaluUgandaUkraineUnited Arab EmiratesUnited KingdomUnited StatesUpper middle incomeUruguayUzbekistanVanuatuVenezuela, RBVietnamWorldYemen, Rep.ZambiaZimbabwe línea de tiempo (timeline):
En esta escala de tiempo se presenta un gráfico de 1982 y 2016 de Post-demographic dividend. Los datos de 1981 están ausentes. El número de observaciones reales por fecha: 35.
Fuente (nombre):
Indicadores del desarrollo mundial
Fuente (organización):
WHO and UNICEF (http://www.who.int/immunization/monitoring_surveillance/en/).
Categorías:
Health
Se ha actualizado:
23 abr 2017 año
Los indicadores de los cambios de valor en los últimos años
Mínimo:
67.937
1 ene 1982 año
Máximo:
92.991
1 ene 2005 año
A la fecha de observación
Valor
Cambio absoluto
El cambio con respecto al valor anterior
1 ene 1982 año
67.937
+67.937
0.0%
1 ene 1983 año
69.166
+1.23
1.81%
1 ene 1984 año
69.8
+0.634
0.92%
1 ene 1985 año
74.862
+5.062
7.25%
1 ene 1986 año
78.886
+4.024
5.37%
1 ene 1987 año
80.919
+2.034
2.58%
1 ene 1988 año
77.163
-3.756
-4.64%
1 ene 1989 año
83.801
+6.637
8.6%
1 ene 1990 año
86.122
+2.322
2.77%
1 ene 1991 año
83.375
-2.747
-3.19%
1 ene 1992 año
82.486
-0.889
-1.07%
1 ene 1993 año
81.957
-0.53
-0.64%
1 ene 1994 año
83.497
+1.54
1.88%
1 ene 1995 año
86.888
+3.391
4.06%
1 ene 1996 año
88.2
+1.312
1.51%
1 ene 1997 año
89.513
+1.313
1.49%
1 ene 1998 año
89.497
-0.016
-0.02%
1 ene 1999 año
89.376
-0.121
-0.14%
1 ene 2000 año
90.602
+1.226
1.37%
1 ene 2001 año
90.904
+0.302
0.33%
1 ene 2002 año
91.495
+0.59
0.65%
1 ene 2003 año
91.908
+0.413
0.45%
1 ene 2004 año
92.758
+0.85
0.93%
1 ene 2005 año
92.991
+0.233
0.25%
1 ene 2006 año
92.617
-0.373
-0.4%
1 ene 2007 año
92.967
+0.35
0.38%
1 ene 2008 año
92.874
-0.094
-0.1%
1 ene 2009 año
92.692
-0.182
-0.2%
1 ene 2010 año
91.091
-1.601
-1.73%
1 ene 2011 año
91.267
+0.176
0.19%
1 ene 2012 año
91.773
+0.506
0.55%
1 ene 2013 año
92.817
+1.045
1.14%
1 ene 2014 año
92.777
-0.041
-0.04%
1 ene 2015 año
92.114
-0.663
-0.71%
1 ene 2016 año
91.89
-0.224
-0.24%
Ranking de los países por los datos estadísticos actuales


Comentarios: