29
/es/
es
AIzaSyAYiBZKx7MnpbEhh9jyipgxe19OcubqV5w
April 1, 2024
41538
Latin America & Caribbean
LCN
false
2
1
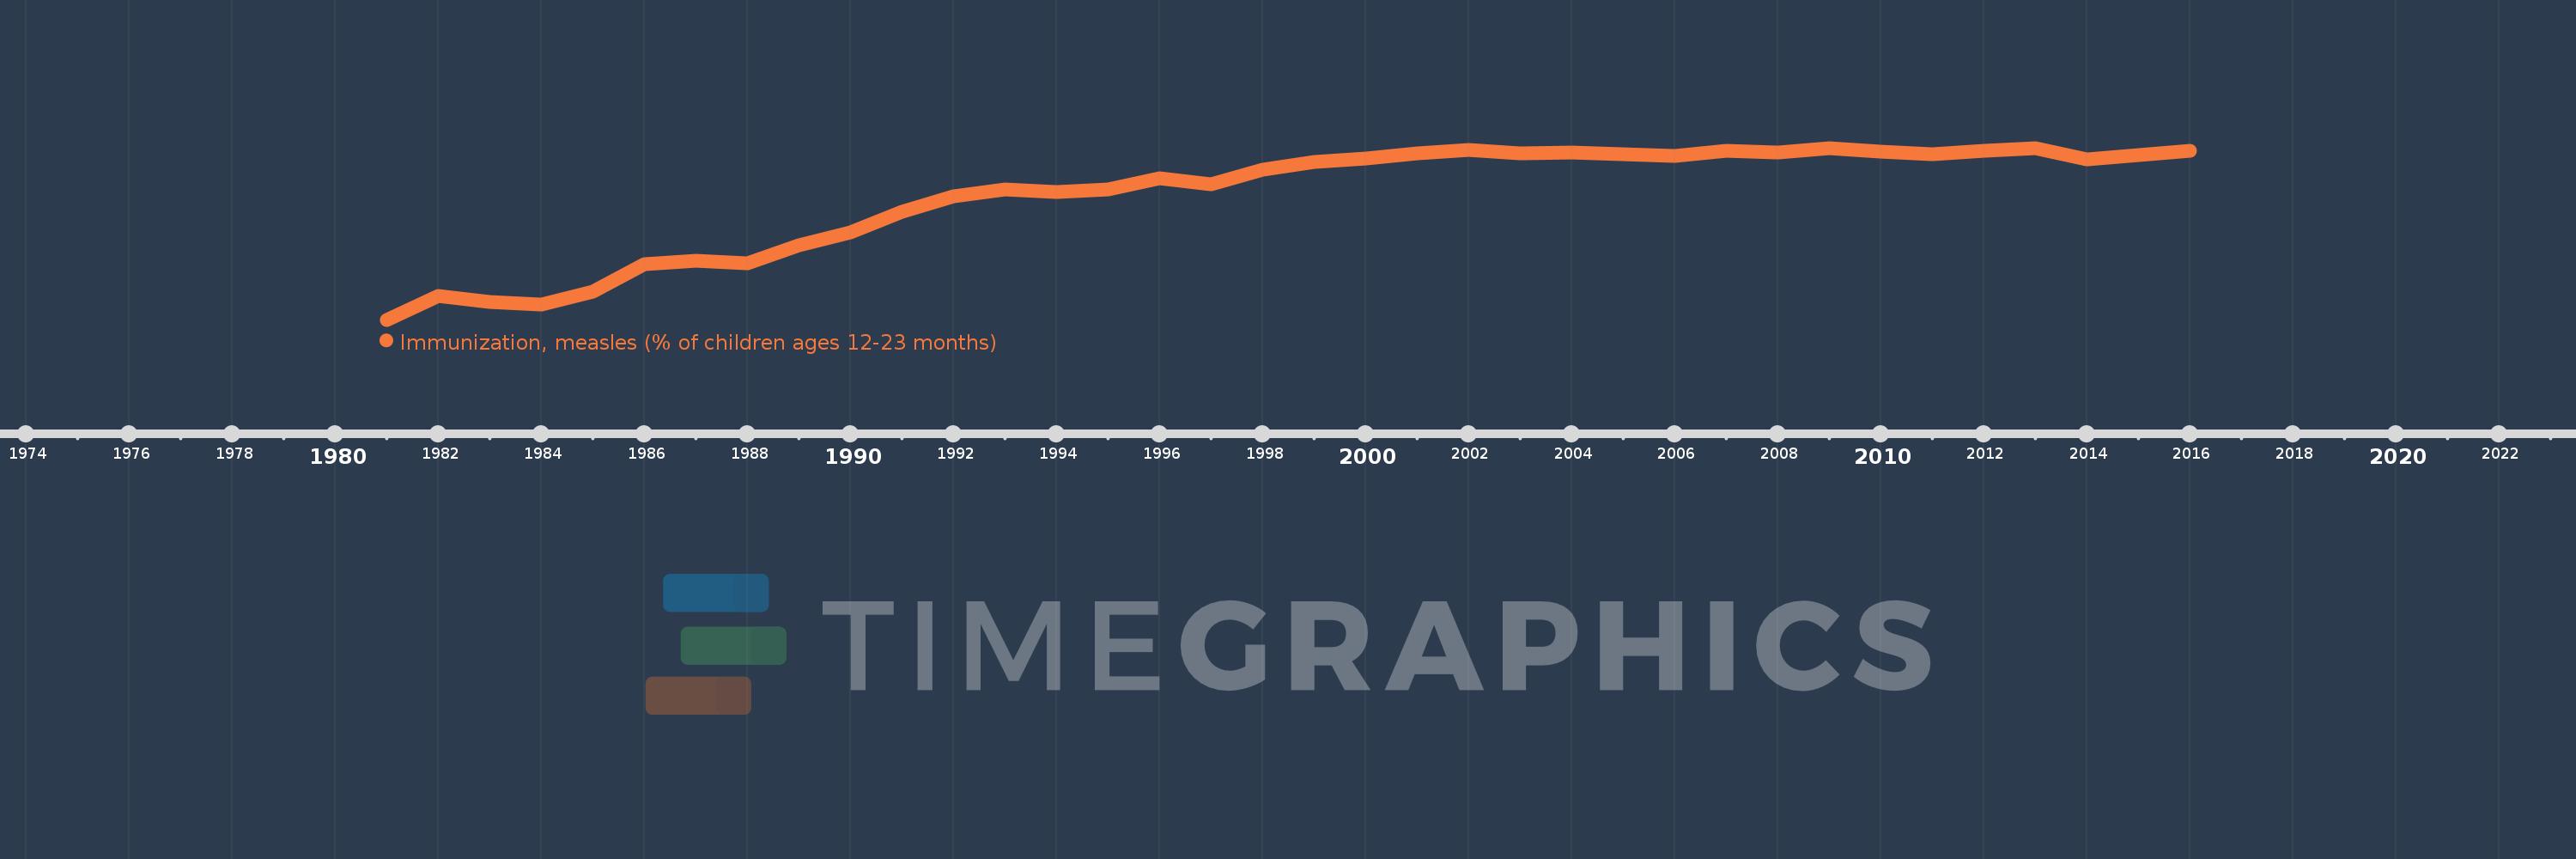
Immunization, measles (% of children ages 12-23 months)
2016,2015,2014,2013,2012,2011,2010,2009,2008,2007,2006,2005,2004,2003,2002,2001,2000,1999,1998,1997,1996,1995,1994,1993,1992,1991,1990,1989,1988,1987,1986,1985,1984,1983,1982,1981
Estas estadísticas en otros países:
AfghanistanAlbaniaAlgeriaAndorraAngolaAntigua and BarbudaArab WorldArgentinaArmeniaAustraliaAustriaAzerbaijanBahamas, TheBahrainBangladeshBarbadosBelarusBelgiumBelizeBeninBhutanBoliviaBosnia and HerzegovinaBotswanaBrazilBrunei DarussalamBulgariaBurkina FasoBurundiCabo VerdeCambodiaCameroonCanadaCaribbean small statesCentral African RepublicCentral Europe and the BalticsChadChileChinaColombiaComorosCongo, Dem. Rep.Congo, Rep.Costa RicaCote d'IvoireCroatiaCubaCyprusCzech RepublicDenmarkDjiboutiDominicaDominican RepublicEarly-demographic dividendEast Asia & PacificEast Asia & Pacific (excluding high income)East Asia & Pacific (IDA & IBRD countries)EcuadorEgypt, Arab Rep.El SalvadorEquatorial GuineaEritreaEstoniaEthiopiaEuro areaEurope & Central AsiaEurope & Central Asia (excluding high income)Europe & Central Asia (IDA & IBRD countries)European UnionFijiFinlandFragile and conflict affected situationsFranceGabonGambia, TheGeorgiaGermanyGhanaGreeceGrenadaGuatemalaGuineaGuinea-BissauGuyanaHaitiHeavily indebted poor countries (HIPC)High incomeHondurasHungaryIBRD onlyIcelandIDA & IBRD totalIDA blendIDA onlyIDA totalIndiaIndonesiaIran, Islamic Rep.IraqIrelandIsraelItalyJamaicaJapanJordanKazakhstanKenyaKiribatiKorea, Dem. People’s Rep.Korea, Rep.KuwaitKyrgyz RepublicLao PDRLate-demographic dividendLatin America & Caribbean Latin America & Caribbean (excluding high income)Latin America & the Caribbean (IDA & IBRD countries)LatviaLeast developed countries: UN classificationLebanonLesothoLiberiaLibyaLithuaniaLow & middle incomeLow incomeLower middle incomeLuxembourgMacedonia, FYRMadagascarMalawiMalaysiaMaldivesMaliMaltaMarshall IslandsMauritaniaMauritiusMexicoMicronesia, Fed. Sts.Middle East & North AfricaMiddle East & North Africa (excluding high income)Middle East & North Africa (IDA & IBRD countries)Middle incomeMoldovaMonacoMongoliaMontenegroMoroccoMozambiqueMyanmarNamibiaNauruNepalNetherlandsNew ZealandNicaraguaNigerNigeriaNorth AmericaNorwayOECD membersOmanOther small statesPacific island small statesPakistanPalauPanamaPapua New GuineaParaguayPeruPhilippinesPolandPortugalPost-demographic dividendPre-demographic dividendQatarRomaniaRussian FederationRwandaSamoaSan MarinoSao Tome and PrincipeSaudi ArabiaSenegalSerbiaSeychellesSierra LeoneSingaporeSlovak RepublicSloveniaSmall statesSolomon IslandsSomaliaSouth AfricaSouth AsiaSouth Asia (IDA & IBRD)South SudanSpainSri LankaSt. Kitts and NevisSt. LuciaSt. Vincent and the GrenadinesSub-Saharan Africa Sub-Saharan Africa (excluding high income)Sub-Saharan Africa (IDA & IBRD countries)SudanSurinameSwazilandSwedenSwitzerlandSyrian Arab RepublicTajikistanTanzaniaThailandTimor-LesteTogoTongaTrinidad and TobagoTunisiaTurkeyTurkmenistanTuvaluUgandaUkraineUnited Arab EmiratesUnited KingdomUnited StatesUpper middle incomeUruguayUzbekistanVanuatuVenezuela, RBVietnamWorldYemen, Rep.ZambiaZimbabwe línea de tiempo (timeline):
En esta escala de tiempo se presenta un gráfico de 1981 y 2016 de Latin America & Caribbean . Los datos de 1980 están ausentes. El número de observaciones reales por fecha: 36.
Fuente (nombre):
Indicadores del desarrollo mundial
Fuente (organización):
WHO and UNICEF (http://www.who.int/immunization/monitoring_surveillance/en/).
Categorías:
Health
Se ha actualizado:
23 abr 2017 año
Los indicadores de los cambios de valor en los últimos años
Mínimo:
43.194
1 ene 1981 año
Máximo:
95.304
1 ene 2013 año
A la fecha de observación
Valor
Cambio absoluto
El cambio con respecto al valor anterior
1 ene 1981 año
43.194
+43.194
0.0%
1 ene 1982 año
50.353
+7.159
16.57%
1 ene 1983 año
48.578
-1.776
-3.53%
1 ene 1984 año
47.75
-0.828
-1.7%
1 ene 1985 año
51.812
+4.062
8.51%
1 ene 1986 año
59.929
+8.117
15.67%
1 ene 1987 año
61.034
+1.106
1.84%
1 ene 1988 año
60.253
-0.781
-1.28%
1 ene 1989 año
65.81
+5.557
9.22%
1 ene 1990 año
69.598
+3.788
5.76%
1 ene 1991 año
75.915
+6.318
9.08%
1 ene 1992 año
80.568
+4.653
6.13%
1 ene 1993 año
82.677
+2.109
2.62%
1 ene 1994 año
82.016
-0.661
-0.8%
1 ene 1995 año
82.598
+0.581
0.71%
1 ene 1996 año
86.161
+3.563
4.31%
1 ene 1997 año
84.193
-1.968
-2.28%
1 ene 1998 año
88.628
+4.435
5.27%
1 ene 1999 año
90.971
+2.343
2.64%
1 ene 2000 año
92.226
+1.255
1.38%
1 ene 2001 año
93.617
+1.391
1.51%
1 ene 2002 año
94.797
+1.179
1.26%
1 ene 2003 año
93.583
-1.214
-1.28%
1 ene 2004 año
94.046
+0.463
0.49%
1 ene 2005 año
93.328
-0.718
-0.76%
1 ene 2006 año
92.972
-0.356
-0.38%
1 ene 2007 año
94.494
+1.523
1.64%
1 ene 2008 año
93.998
-0.496
-0.53%
1 ene 2009 año
95.203
+1.205
1.28%
1 ene 2010 año
94.148
-1.055
-1.11%
1 ene 2011 año
93.443
-0.705
-0.75%
1 ene 2012 año
94.459
+1.016
1.09%
1 ene 2013 año
95.304
+0.845
0.89%
1 ene 2014 año
91.924
-3.38
-3.55%
1 ene 2015 año
93.094
+1.17
1.27%
1 ene 2016 año
94.369
+1.274
1.37%
Ranking de los países por los datos estadísticos actuales


Comentarios: