29
/es/
es
AIzaSyAYiBZKx7MnpbEhh9jyipgxe19OcubqV5w
April 1, 2024
54373
Pacific island small states
PSS
false
2
1
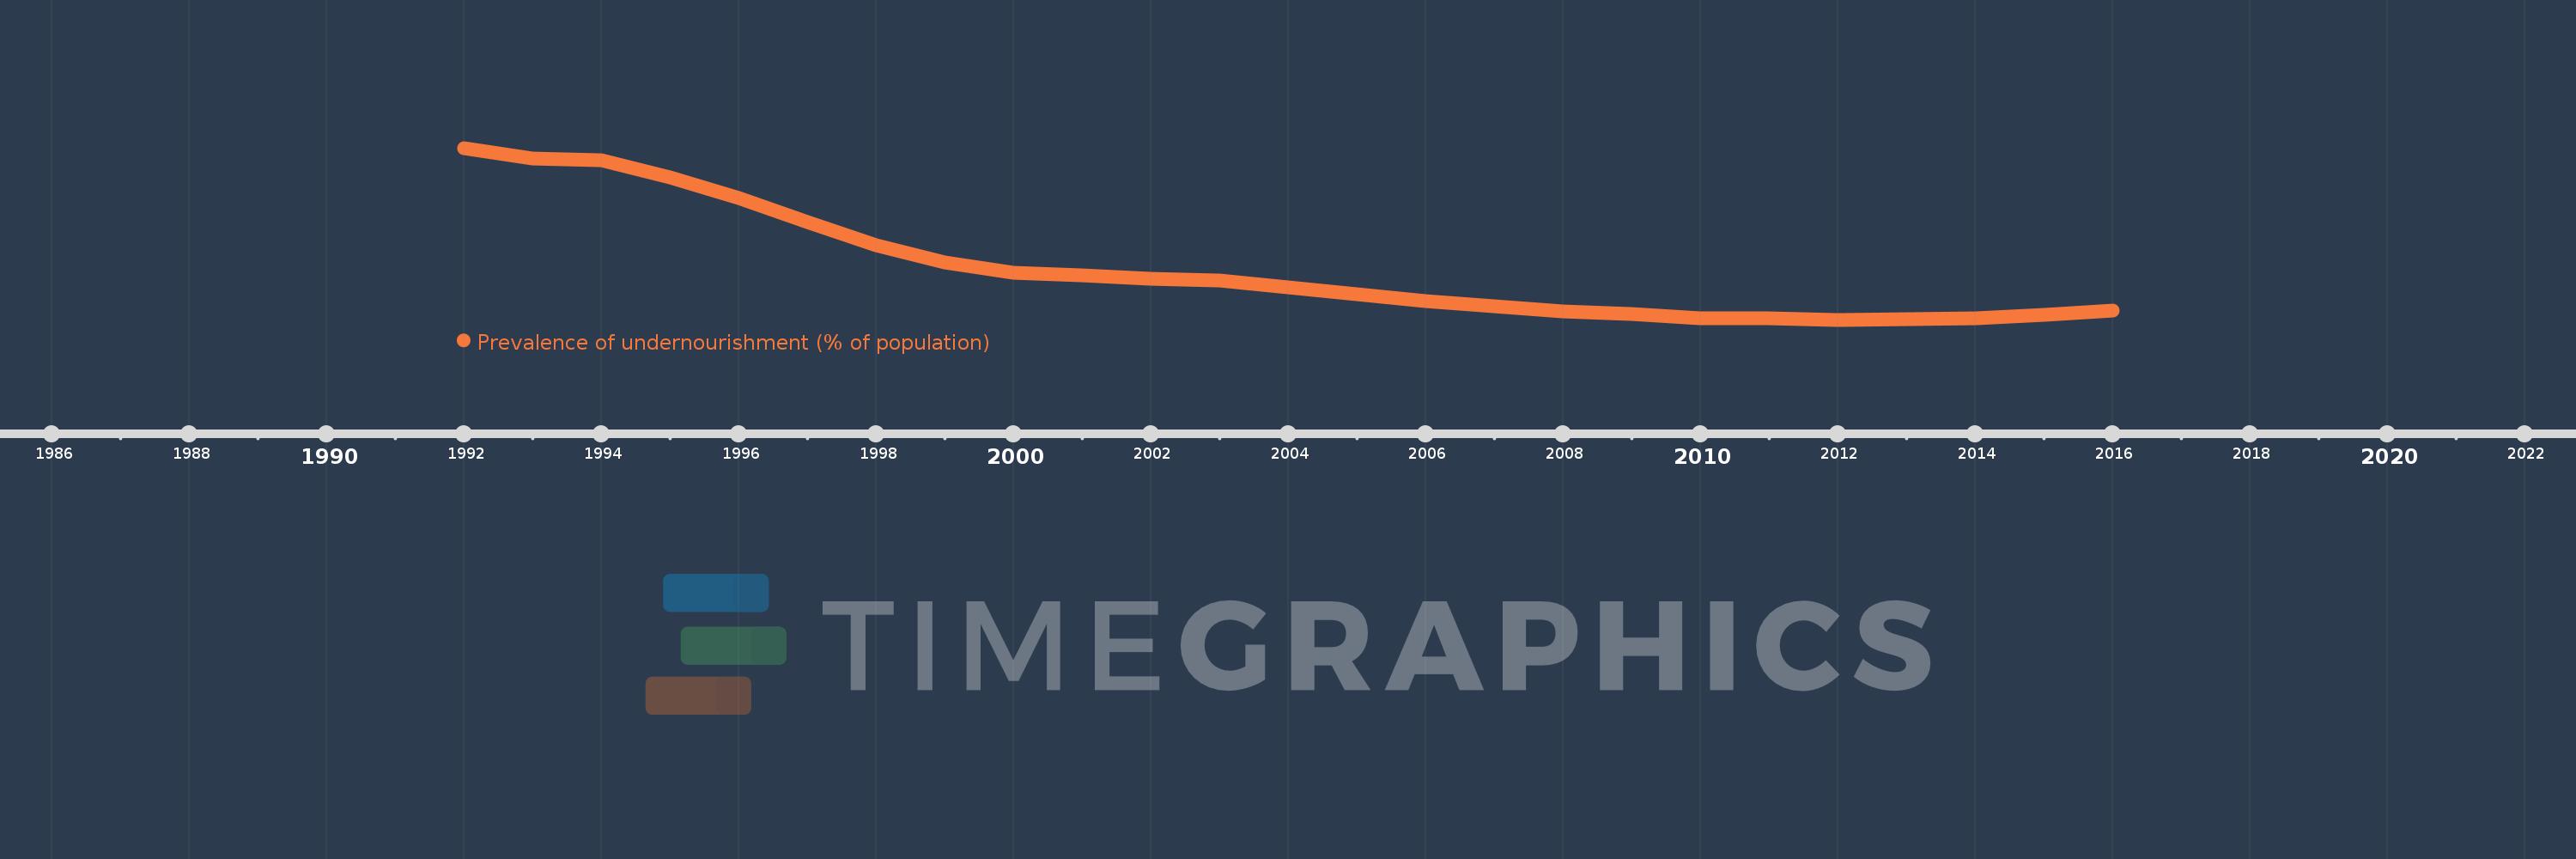
Prevalence of undernourishment (% of population)
2016,2015,2014,2013,2012,2011,2010,2009,2008,2007,2006,2005,2004,2003,2002,2001,2000,1999,1998,1997,1996,1995,1994,1993,1992
Estas estadísticas en otros países:
línea de tiempo (timeline):
En esta escala de tiempo se presenta un gráfico de 1992 y 2016 de Pacific island small states. Los datos de 1991 están ausentes. El número de observaciones reales por fecha: 25.
Fuente (nombre):
Indicadores del desarrollo mundial
Fuente (organización):
Food and Agriculture Organization (http://www.fao.org/publications/en/).
Categorías:
Health
Se ha actualizado:
23 abr 2017 año
Los indicadores de los cambios de valor en los últimos años
Mínimo:
6.718
1 ene 2012 año
Máximo:
11.632
1 ene 1992 año
A la fecha de observación
Valor
Cambio absoluto
El cambio con respecto al valor anterior
1 ene 1992 año
11.632
+11.632
0.0%
1 ene 1993 año
11.326
-0.306
-2.63%
1 ene 1994 año
11.273
-0.053
-0.47%
1 ene 1995 año
10.797
-0.476
-4.22%
1 ene 1996 año
10.198
-0.6
-5.55%
1 ene 1997 año
9.5
-0.698
-6.84%
1 ene 1998 año
8.84
-0.66
-6.94%
1 ene 1999 año
8.364
-0.476
-5.38%
1 ene 2000 año
8.068
-0.296
-3.54%
1 ene 2001 año
7.984
-0.084
-1.04%
1 ene 2002 año
7.888
-0.096
-1.2%
1 ene 2003 año
7.844
-0.044
-0.56%
1 ene 2004 año
7.641
-0.203
-2.59%
1 ene 2005 año
7.446
-0.195
-2.55%
1 ene 2006 año
7.242
-0.204
-2.74%
1 ene 2007 año
7.11
-0.132
-1.83%
1 ene 2008 año
6.96
-0.15
-2.11%
1 ene 2009 año
6.872
-0.088
-1.27%
1 ene 2010 año
6.751
-0.121
-1.76%
1 ene 2011 año
6.748
-0.003
-0.04%
1 ene 2012 año
6.718
-0.03
-0.45%
1 ene 2013 año
6.728
+0.01
0.15%
1 ene 2014 año
6.753
+0.025
0.38%
1 ene 2015 año
6.851
+0.098
1.45%
1 ene 2016 año
6.978
+0.127
1.86%
Ranking de los países por los datos estadísticos actuales


Comentarios: