30
/es/
AIzaSyAYiBZKx7MnpbEhh9jyipgxe19OcubqV5w
April 1, 2024
265184
Togo
TGO
true
2
1
Prevalence of undernourishment (% of population)
2016,2015,2014,2013,2012,2011,2010,2009,2008,2007,2006,2005,2004,2003,2002,2001,2000,1999,1998,1997,1996,1995,1994,1993,1992
Download
Estadísticas Globales de la Biblioteca →Togo →

Prevalence of undernourishment (% of population)

Estas estadísticas en otros países:

AfghanistanAlgeriaAngolaArab WorldArgentinaArmeniaAzerbaijanBangladeshBarbadosBelizeBeninBoliviaBotswanaBrazilBrunei DarussalamBurkina FasoCabo VerdeCambodiaCameroonCaribbean small statesCentral African RepublicChadChileChinaColombiaCongo, Rep.Costa RicaCote d'IvoireCubaDjiboutiDominican RepublicEarly-demographic dividendEast Asia & PacificEast Asia & Pacific (excluding high income)East Asia & Pacific (IDA & IBRD countries)EcuadorEgypt, Arab Rep.El SalvadorEthiopiaFijiGabonGambia, TheGeorgiaGhanaGuatemalaGuineaGuinea-BissauGuyanaHaitiHeavily indebted poor countries (HIPC)HondurasIBRD onlyIDA & IBRD totalIDA blendIDA onlyIDA totalIndiaIndonesiaIran, Islamic Rep.IraqJamaicaJordanKazakhstanKenyaKiribatiKorea, Dem. People’s Rep.Korea, Rep.KuwaitKyrgyz RepublicLao PDRLate-demographic dividendLatin America & Caribbean Latin America & Caribbean (excluding high income)Latin America & the Caribbean (IDA & IBRD countries)Least developed countries: UN classificationLebanonLesothoLiberiaLow & middle incomeLow incomeLower middle incomeMadagascarMalawiMalaysiaMaldivesMaliMauritaniaMauritiusMexicoMiddle East & North AfricaMiddle East & North Africa (excluding high income)Middle East & North Africa (IDA & IBRD countries)Middle incomeMongoliaMoroccoMozambiqueMyanmarNamibiaNepalNicaraguaNigerNigeriaOmanOther small statesPacific island small statesPakistanPanamaParaguayPeruPhilippinesPre-demographic dividendRwandaSamoaSao Tome and PrincipeSaudi ArabiaSenegalSierra LeoneSmall statesSolomon IslandsSouth AfricaSouth AsiaSouth Asia (IDA & IBRD)Sri LankaSt. Vincent and the GrenadinesSub-Saharan Africa Sub-Saharan Africa (excluding high income)Sub-Saharan Africa (IDA & IBRD countries)SurinameSwazilandTajikistanTanzaniaThailandTimor-LesteTogoTrinidad and TobagoTunisiaTurkeyTurkmenistanUgandaUnited Arab EmiratesUpper middle incomeUruguayUzbekistanVanuatuVenezuela, RBVietnamWorldYemen, Rep.ZambiaZimbabwe

línea de tiempo (timeline):

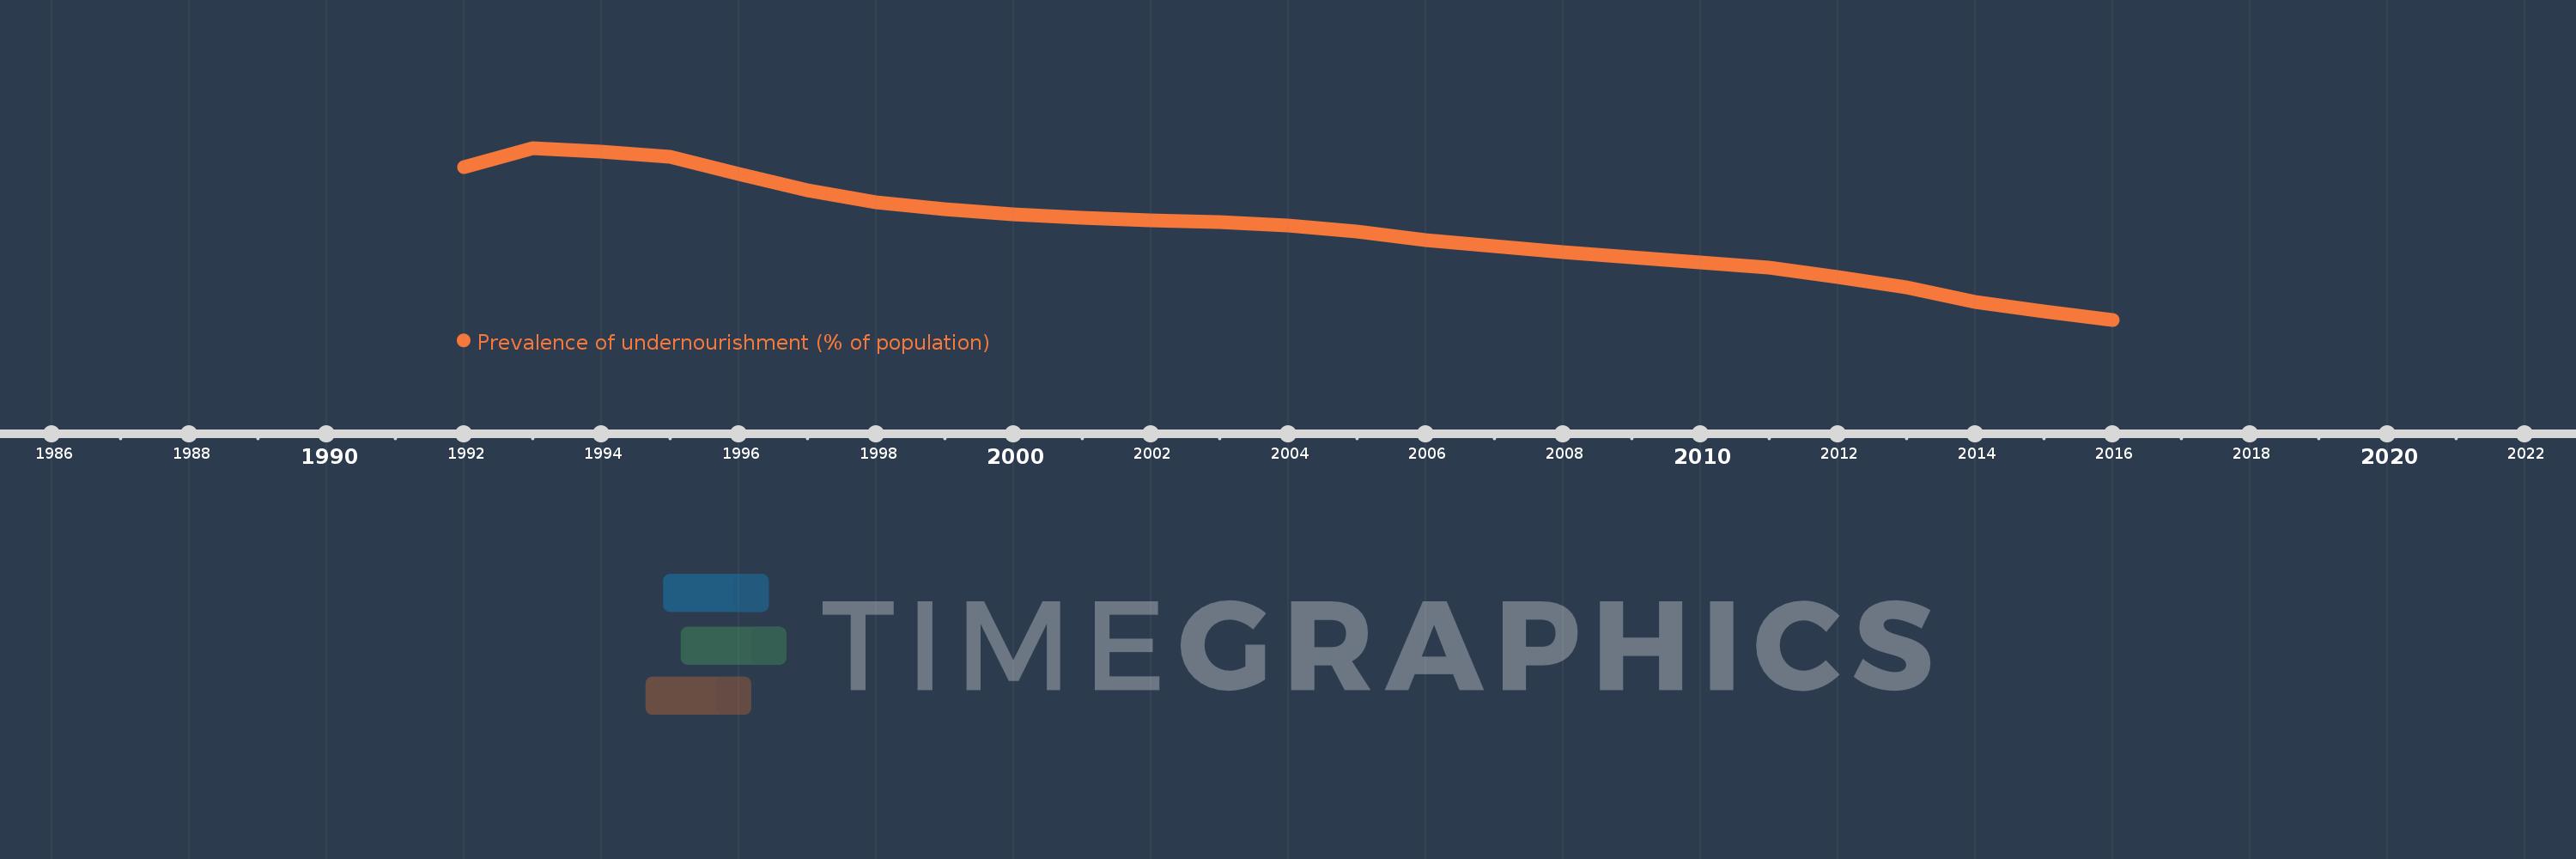
En esta escala de tiempo se presenta un gráfico de 1992 y 2016 de Togo. Los datos de 1991 están ausentes. El número de observaciones reales por fecha: 25.

Fuente (nombre):

Indicadores del desarrollo mundial

Fuente (organización):

Food and Agriculture Organization (http://www.fao.org/publications/en/).

Categorías:

Health

Se ha actualizado:

23 abr 2017 año

Los indicadores de los cambios de valor en los últimos años

En promedio:
27.0
Mínimo:
11.4
1 ene 2016 año
Máximo:
41.3
1 ene 1993 año
A la fecha de observación
Valor
Cambio absoluto
El cambio con respecto al valor anterior
1 ene 1992 año
37.9
+37.9
0.0%
1 ene 1993 año
41.3
+3.4
8.97%
1 ene 1994 año
40.6
-0.7
-1.69%
1 ene 1995 año
39.7
-0.9
-2.22%
1 ene 1996 año
36.8
-2.9
-7.3%
1 ene 1997 año
34.0
-2.8
-7.61%
1 ene 1998 año
31.9
-2.1
-6.18%
1 ene 1999 año
30.6
-1.3
-4.08%
1 ene 2000 año
29.8
-0.8
-2.61%
1 ene 2001 año
29.2
-0.6
-2.01%
1 ene 2002 año
28.7
-0.5
-1.71%
1 ene 2003 año
28.4
-0.3
-1.05%
1 ene 2004 año
27.8
-0.6
-2.11%
1 ene 2005 año
26.7
-1.1
-3.96%
1 ene 2006 año
25.3
-1.4
-5.24%
1 ene 2007 año
24.2
-1.1
-4.35%
1 ene 2008 año
23.2
-1.0
-4.13%
1 ene 2009 año
22.3
-0.9
-3.88%
1 ene 2010 año
21.3
-1.0
-4.48%
1 ene 2011 año
20.5
-0.8
-3.76%
1 ene 2012 año
18.9
-1.6
-7.8%
1 ene 2013 año
17.1
-1.8
-9.52%
1 ene 2014 año
14.5
-2.6
-15.2%
1 ene 2015 año
12.9
-1.6
-11.03%
1 ene 2016 año
11.4
-1.5
-11.63%

Ranking de los países por los datos estadísticos actuales