29
/es/
es
AIzaSyAYiBZKx7MnpbEhh9jyipgxe19OcubqV5w
April 1, 2024
53479
Other small states
OSS
false
2
1
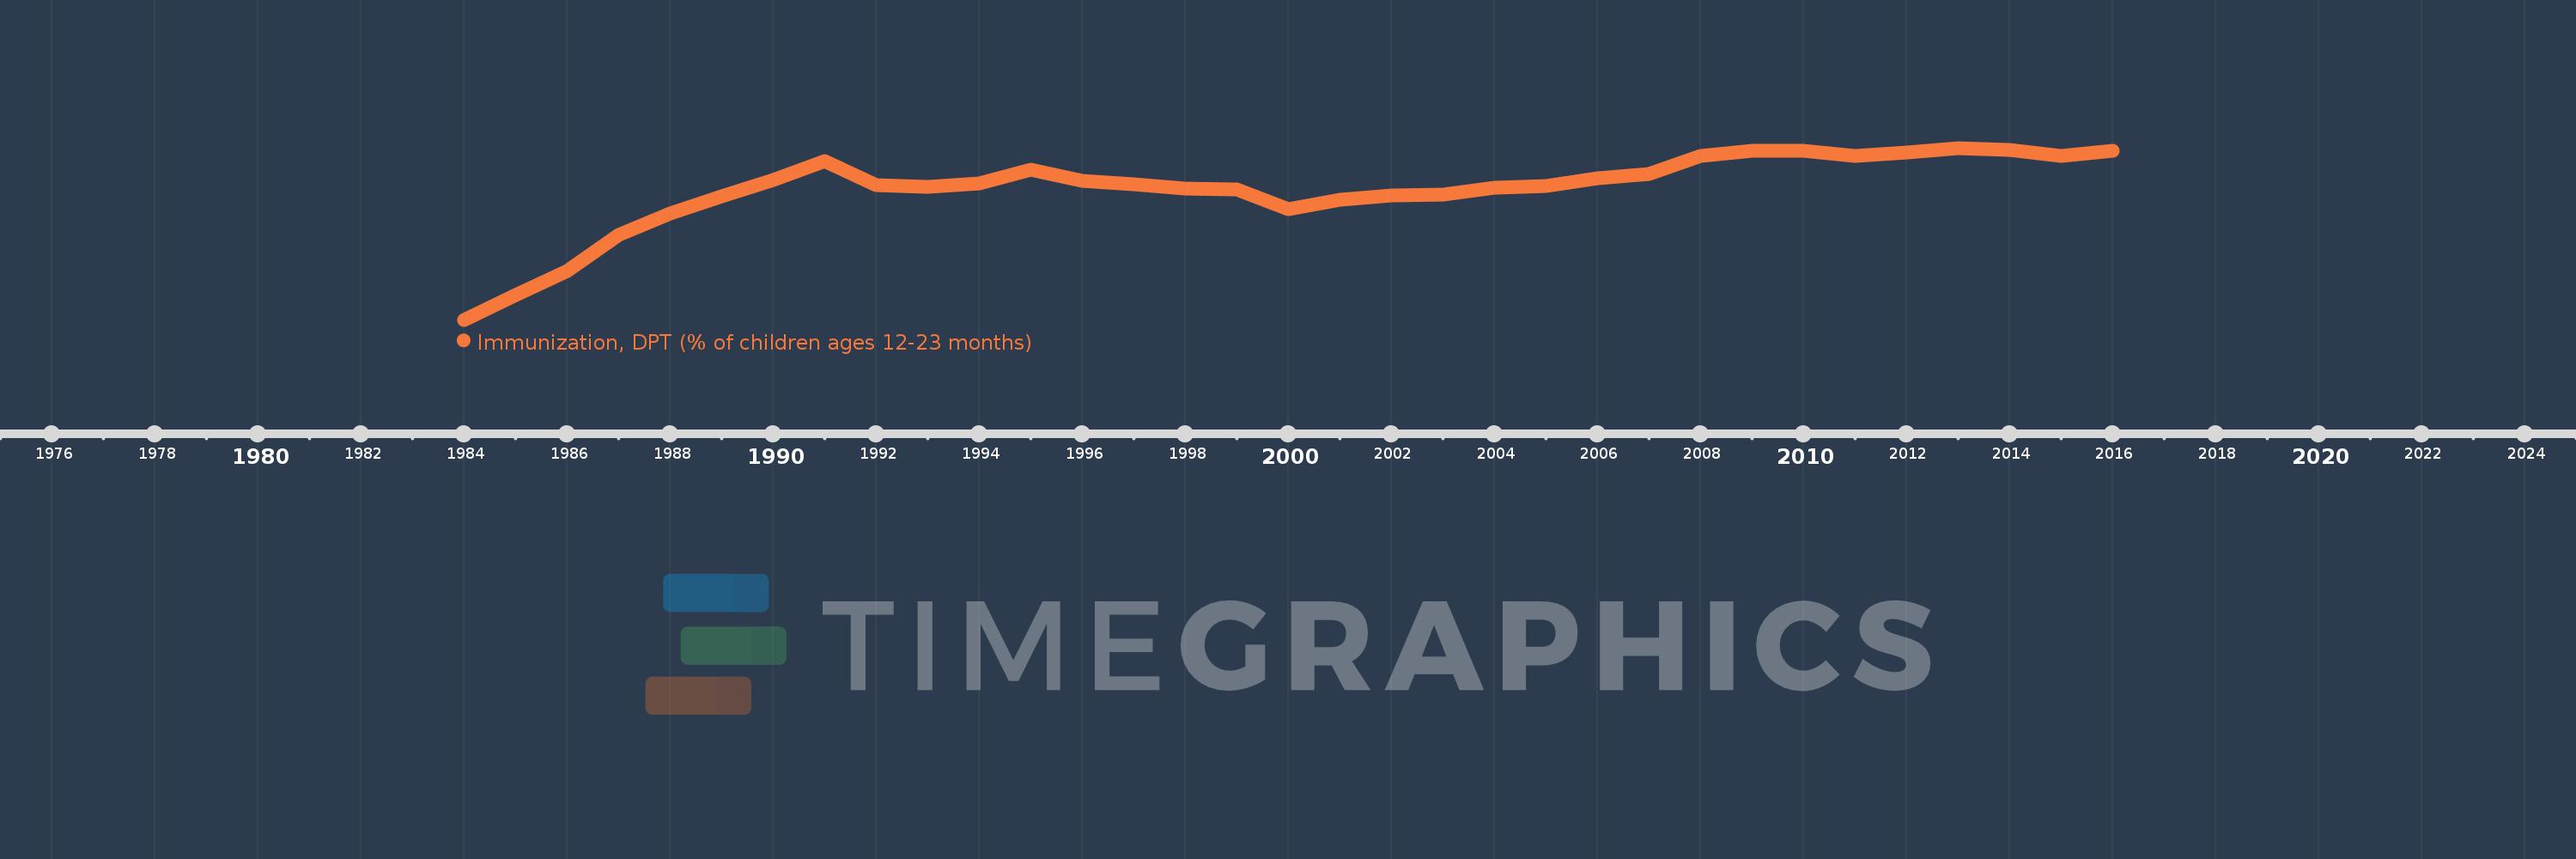
Immunization, DPT (% of children ages 12-23 months)
2016,2015,2014,2013,2012,2011,2010,2009,2008,2007,2006,2005,2004,2003,2002,2001,2000,1999,1998,1997,1996,1995,1994,1993,1992,1991,1990,1989,1988,1987,1986,1985,1984
Estas estadísticas en otros países:
AfghanistanAlbaniaAlgeriaAndorraAngolaAntigua and BarbudaArab WorldArgentinaArmeniaAustraliaAustriaAzerbaijanBahamas, TheBahrainBangladeshBarbadosBelarusBelgiumBelizeBeninBhutanBoliviaBosnia and HerzegovinaBotswanaBrazilBrunei DarussalamBulgariaBurkina FasoBurundiCabo VerdeCambodiaCameroonCanadaCaribbean small statesCentral African RepublicCentral Europe and the BalticsChadChileChinaColombiaComorosCongo, Dem. Rep.Congo, Rep.Costa RicaCote d'IvoireCroatiaCubaCyprusCzech RepublicDenmarkDjiboutiDominicaDominican RepublicEarly-demographic dividendEast Asia & PacificEast Asia & Pacific (excluding high income)East Asia & Pacific (IDA & IBRD countries)EcuadorEgypt, Arab Rep.El SalvadorEquatorial GuineaEritreaEstoniaEthiopiaEuro areaEurope & Central AsiaEurope & Central Asia (excluding high income)Europe & Central Asia (IDA & IBRD countries)European UnionFijiFinlandFragile and conflict affected situationsFranceGabonGambia, TheGeorgiaGermanyGhanaGreeceGrenadaGuatemalaGuineaGuinea-BissauGuyanaHaitiHeavily indebted poor countries (HIPC)High incomeHondurasHungaryIBRD onlyIcelandIDA & IBRD totalIDA blendIDA onlyIDA totalIndiaIndonesiaIran, Islamic Rep.IraqIrelandIsraelItalyJamaicaJapanJordanKazakhstanKenyaKiribatiKorea, Dem. People’s Rep.Korea, Rep.KuwaitKyrgyz RepublicLao PDRLate-demographic dividendLatin America & Caribbean Latin America & Caribbean (excluding high income)Latin America & the Caribbean (IDA & IBRD countries)LatviaLeast developed countries: UN classificationLebanonLesothoLiberiaLibyaLithuaniaLow & middle incomeLow incomeLower middle incomeLuxembourgMacedonia, FYRMadagascarMalawiMalaysiaMaldivesMaliMaltaMarshall IslandsMauritaniaMauritiusMexicoMicronesia, Fed. Sts.Middle East & North AfricaMiddle East & North Africa (excluding high income)Middle East & North Africa (IDA & IBRD countries)Middle incomeMoldovaMonacoMongoliaMontenegroMoroccoMozambiqueMyanmarNamibiaNauruNepalNetherlandsNew ZealandNicaraguaNigerNigeriaNorth AmericaNorwayOECD membersOmanOther small statesPacific island small statesPakistanPalauPanamaPapua New GuineaParaguayPeruPhilippinesPolandPortugalPost-demographic dividendPre-demographic dividendQatarRomaniaRussian FederationRwandaSamoaSan MarinoSao Tome and PrincipeSaudi ArabiaSenegalSerbiaSeychellesSierra LeoneSingaporeSlovak RepublicSloveniaSmall statesSolomon IslandsSomaliaSouth AfricaSouth AsiaSouth Asia (IDA & IBRD)South SudanSpainSri LankaSt. Kitts and NevisSt. LuciaSt. Vincent and the GrenadinesSub-Saharan Africa Sub-Saharan Africa (excluding high income)Sub-Saharan Africa (IDA & IBRD countries)SudanSurinameSwazilandSwedenSwitzerlandSyrian Arab RepublicTajikistanTanzaniaThailandTimor-LesteTogoTongaTrinidad and TobagoTunisiaTurkeyTurkmenistanTuvaluUgandaUkraineUnited Arab EmiratesUnited KingdomUnited StatesUpper middle incomeUruguayUzbekistanVanuatuVenezuela, RBVietnamWorldYemen, Rep.ZambiaZimbabwe línea de tiempo (timeline):
En esta escala de tiempo se presenta un gráfico de 1984 y 2016 de Other small states. Los datos de 1983 están ausentes. El número de observaciones reales por fecha: 33.
Fuente (nombre):
Indicadores del desarrollo mundial
Fuente (organización):
WHO and UNICEF (http://www.who.int/immunization/monitoring_surveillance/en/).
Categorías:
Health
Se ha actualizado:
23 abr 2017 año
Los indicadores de los cambios de valor en los últimos años
Mínimo:
49.161
1 ene 1984 año
Máximo:
87.804
1 ene 2013 año
A la fecha de observación
Valor
Cambio absoluto
El cambio con respecto al valor anterior
1 ene 1984 año
49.161
+49.161
0.0%
1 ene 1985 año
54.795
+5.634
11.46%
1 ene 1986 año
60.135
+5.34
9.74%
1 ene 1987 año
68.287
+8.152
13.56%
1 ene 1988 año
73.052
+4.765
6.98%
1 ene 1989 año
76.888
+3.836
5.25%
1 ene 1990 año
80.662
+3.774
4.91%
1 ene 1991 año
84.936
+4.274
5.3%
1 ene 1992 año
79.444
-5.492
-6.47%
1 ene 1993 año
79.036
-0.408
-0.51%
1 ene 1994 año
79.778
+0.742
0.94%
1 ene 1995 año
82.934
+3.156
3.96%
1 ene 1996 año
80.46
-2.474
-2.98%
1 ene 1997 año
79.667
-0.793
-0.99%
1 ene 1998 año
78.755
-0.912
-1.14%
1 ene 1999 año
78.432
-0.322
-0.41%
1 ene 2000 año
73.985
-4.448
-5.67%
1 ene 2001 año
76.083
+2.098
2.84%
1 ene 2002 año
77.057
+0.974
1.28%
1 ene 2003 año
77.388
+0.331
0.43%
1 ene 2004 año
78.861
+1.473
1.9%
1 ene 2005 año
79.256
+0.395
0.5%
1 ene 2006 año
81.059
+1.803
2.27%
1 ene 2007 año
82.023
+0.964
1.19%
1 ene 2008 año
85.969
+3.946
4.81%
1 ene 2009 año
87.166
+1.197
1.39%
1 ene 2010 año
87.217
+0.051
0.06%
1 ene 2011 año
86.1
-1.117
-1.28%
1 ene 2012 año
86.699
+0.599
0.7%
1 ene 2013 año
87.804
+1.105
1.27%
1 ene 2014 año
87.347
-0.457
-0.52%
1 ene 2015 año
86.089
-1.258
-1.44%
1 ene 2016 año
87.156
+1.067
1.24%
Ranking de los países por los datos estadísticos actuales


Comentarios: