29
/es/
es
AIzaSyAYiBZKx7MnpbEhh9jyipgxe19OcubqV5w
April 1, 2024
50099
Middle East & North Africa (IDA & IBRD countries)
TMN
false
2
1
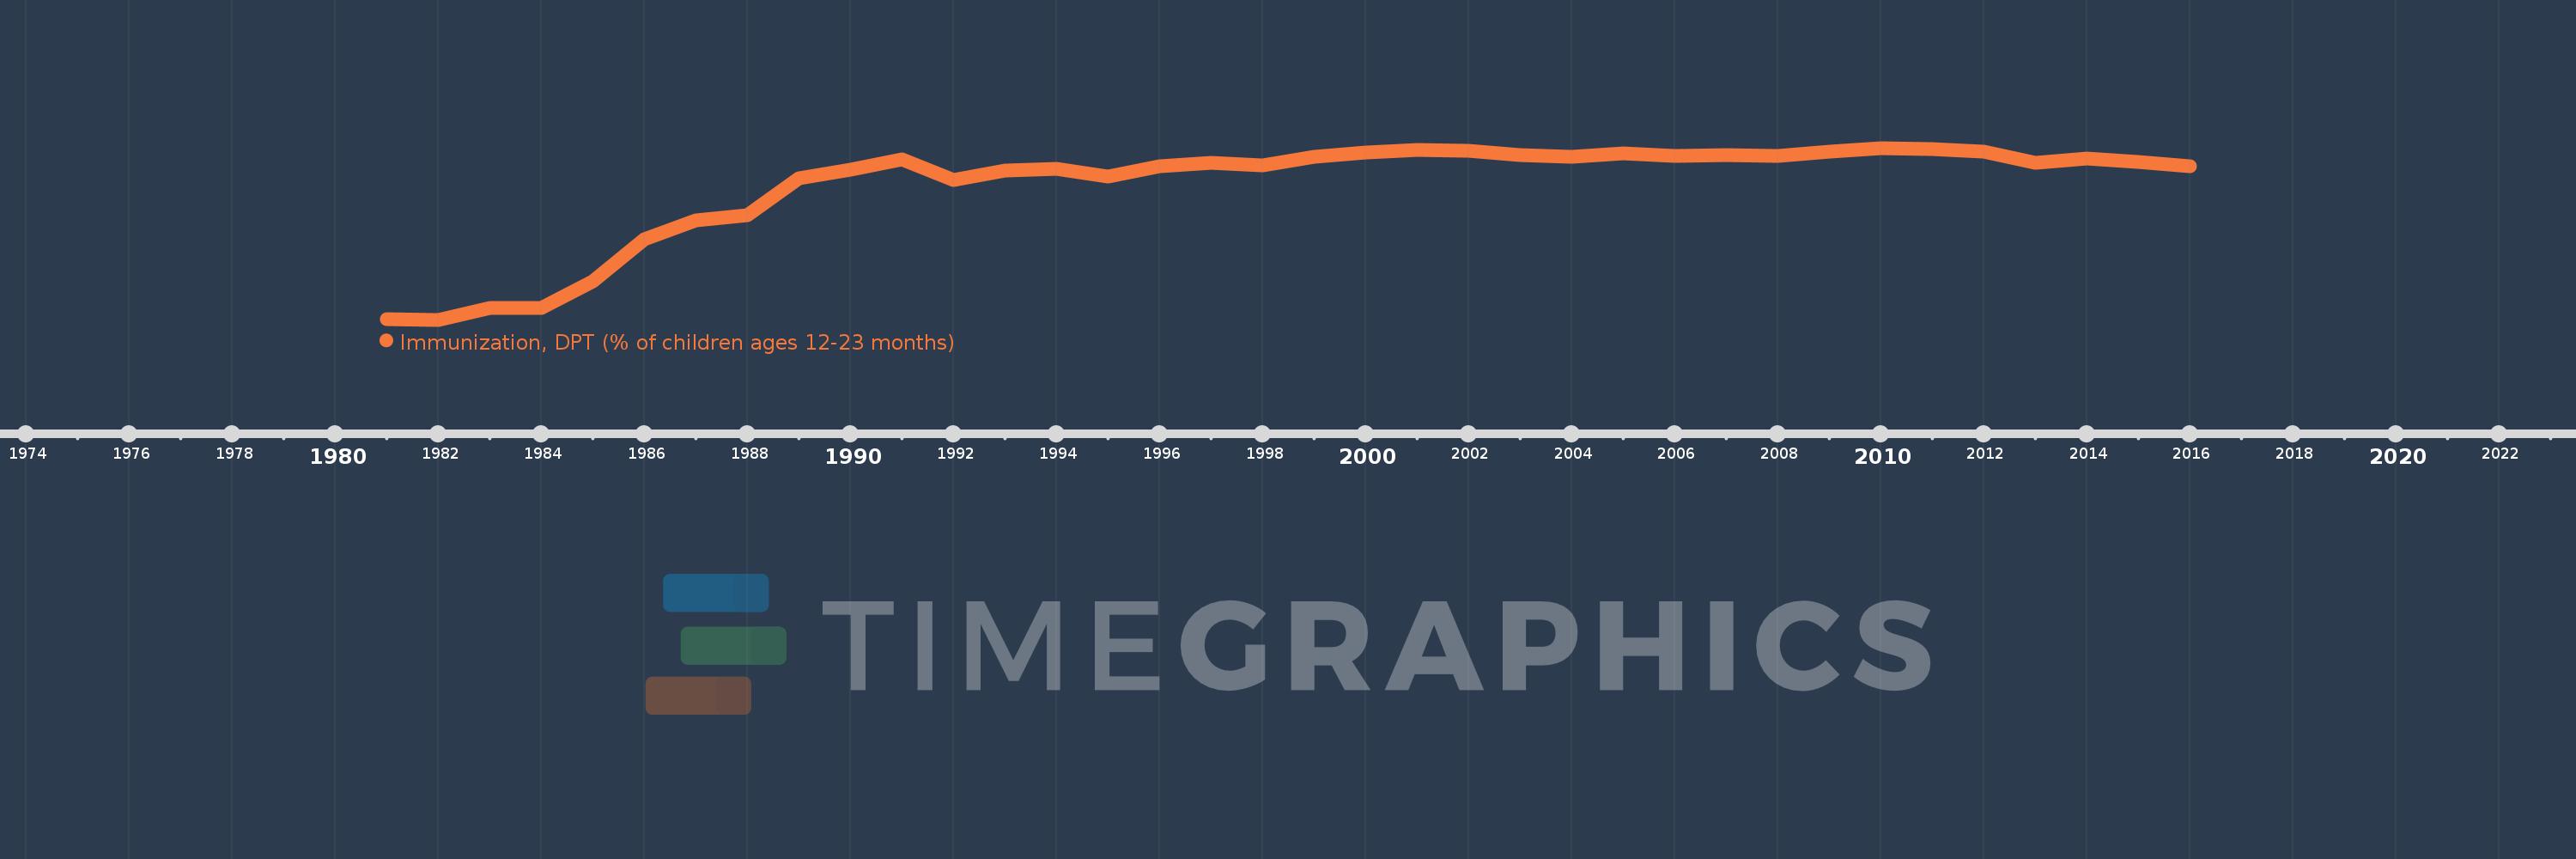
Immunization, DPT (% of children ages 12-23 months)
2016,2015,2014,2013,2012,2011,2010,2009,2008,2007,2006,2005,2004,2003,2002,2001,2000,1999,1998,1997,1996,1995,1994,1993,1992,1991,1990,1989,1988,1987,1986,1985,1984,1983,1982,1981
Estas estadísticas en otros países:
AfghanistanAlbaniaAlgeriaAndorraAngolaAntigua and BarbudaArab WorldArgentinaArmeniaAustraliaAustriaAzerbaijanBahamas, TheBahrainBangladeshBarbadosBelarusBelgiumBelizeBeninBhutanBoliviaBosnia and HerzegovinaBotswanaBrazilBrunei DarussalamBulgariaBurkina FasoBurundiCabo VerdeCambodiaCameroonCanadaCaribbean small statesCentral African RepublicCentral Europe and the BalticsChadChileChinaColombiaComorosCongo, Dem. Rep.Congo, Rep.Costa RicaCote d'IvoireCroatiaCubaCyprusCzech RepublicDenmarkDjiboutiDominicaDominican RepublicEarly-demographic dividendEast Asia & PacificEast Asia & Pacific (excluding high income)East Asia & Pacific (IDA & IBRD countries)EcuadorEgypt, Arab Rep.El SalvadorEquatorial GuineaEritreaEstoniaEthiopiaEuro areaEurope & Central AsiaEurope & Central Asia (excluding high income)Europe & Central Asia (IDA & IBRD countries)European UnionFijiFinlandFragile and conflict affected situationsFranceGabonGambia, TheGeorgiaGermanyGhanaGreeceGrenadaGuatemalaGuineaGuinea-BissauGuyanaHaitiHeavily indebted poor countries (HIPC)High incomeHondurasHungaryIBRD onlyIcelandIDA & IBRD totalIDA blendIDA onlyIDA totalIndiaIndonesiaIran, Islamic Rep.IraqIrelandIsraelItalyJamaicaJapanJordanKazakhstanKenyaKiribatiKorea, Dem. People’s Rep.Korea, Rep.KuwaitKyrgyz RepublicLao PDRLate-demographic dividendLatin America & Caribbean Latin America & Caribbean (excluding high income)Latin America & the Caribbean (IDA & IBRD countries)LatviaLeast developed countries: UN classificationLebanonLesothoLiberiaLibyaLithuaniaLow & middle incomeLow incomeLower middle incomeLuxembourgMacedonia, FYRMadagascarMalawiMalaysiaMaldivesMaliMaltaMarshall IslandsMauritaniaMauritiusMexicoMicronesia, Fed. Sts.Middle East & North AfricaMiddle East & North Africa (excluding high income)Middle East & North Africa (IDA & IBRD countries)Middle incomeMoldovaMonacoMongoliaMontenegroMoroccoMozambiqueMyanmarNamibiaNauruNepalNetherlandsNew ZealandNicaraguaNigerNigeriaNorth AmericaNorwayOECD membersOmanOther small statesPacific island small statesPakistanPalauPanamaPapua New GuineaParaguayPeruPhilippinesPolandPortugalPost-demographic dividendPre-demographic dividendQatarRomaniaRussian FederationRwandaSamoaSan MarinoSao Tome and PrincipeSaudi ArabiaSenegalSerbiaSeychellesSierra LeoneSingaporeSlovak RepublicSloveniaSmall statesSolomon IslandsSomaliaSouth AfricaSouth AsiaSouth Asia (IDA & IBRD)South SudanSpainSri LankaSt. Kitts and NevisSt. LuciaSt. Vincent and the GrenadinesSub-Saharan Africa Sub-Saharan Africa (excluding high income)Sub-Saharan Africa (IDA & IBRD countries)SudanSurinameSwazilandSwedenSwitzerlandSyrian Arab RepublicTajikistanTanzaniaThailandTimor-LesteTogoTongaTrinidad and TobagoTunisiaTurkeyTurkmenistanTuvaluUgandaUkraineUnited Arab EmiratesUnited KingdomUnited StatesUpper middle incomeUruguayUzbekistanVanuatuVenezuela, RBVietnamWorldYemen, Rep.ZambiaZimbabwe línea de tiempo (timeline):
En esta escala de tiempo se presenta un gráfico de 1981 y 2016 de Middle East & North Africa (IDA & IBRD countries). Los datos de 1980 están ausentes. El número de observaciones reales por fecha: 36.
Fuente (nombre):
Indicadores del desarrollo mundial
Fuente (organización):
WHO and UNICEF (http://www.who.int/immunization/monitoring_surveillance/en/).
Categorías:
Health
Se ha actualizado:
23 abr 2017 año
Los indicadores de los cambios de valor en los últimos años
Mínimo:
34.49
1 ene 1982 año
Máximo:
91.211
1 ene 2010 año
A la fecha de observación
Valor
Cambio absoluto
El cambio con respecto al valor anterior
1 ene 1981 año
34.728
+34.728
0.0%
1 ene 1982 año
34.49
-0.237
-0.68%
1 ene 1983 año
38.27
+3.78
10.96%
1 ene 1984 año
38.339
+0.069
0.18%
1 ene 1985 año
47.241
+8.902
23.22%
1 ene 1986 año
61.053
+13.812
29.24%
1 ene 1987 año
67.403
+6.35
10.4%
1 ene 1988 año
69.068
+1.665
2.47%
1 ene 1989 año
81.335
+12.268
17.76%
1 ene 1990 año
84.177
+2.842
3.49%
1 ene 1991 año
87.508
+3.331
3.96%
1 ene 1992 año
80.496
-7.012
-8.01%
1 ene 1993 año
83.676
+3.18
3.95%
1 ene 1994 año
84.327
+0.651
0.78%
1 ene 1995 año
81.834
-2.493
-2.96%
1 ene 1996 año
85.111
+3.276
4.0%
1 ene 1997 año
86.44
+1.329
1.56%
1 ene 1998 año
85.512
-0.929
-1.07%
1 ene 1999 año
88.327
+2.815
3.29%
1 ene 2000 año
89.655
+1.328
1.5%
1 ene 2001 año
90.667
+1.012
1.13%
1 ene 2002 año
90.378
-0.289
-0.32%
1 ene 2003 año
88.981
-1.397
-1.55%
1 ene 2004 año
88.307
-0.674
-0.76%
1 ene 2005 año
89.315
+1.008
1.14%
1 ene 2006 año
88.598
-0.717
-0.8%
1 ene 2007 año
88.914
+0.316
0.36%
1 ene 2008 año
88.583
-0.331
-0.37%
1 ene 2009 año
89.881
+1.297
1.46%
1 ene 2010 año
91.211
+1.33
1.48%
1 ene 2011 año
90.708
-0.503
-0.55%
1 ene 2012 año
89.948
-0.761
-0.84%
1 ene 2013 año
86.321
-3.627
-4.03%
1 ene 2014 año
87.715
+1.395
1.62%
1 ene 2015 año
86.714
-1.001
-1.14%
1 ene 2016 año
85.033
-1.681
-1.94%
Ranking de los países por los datos estadísticos actuales


Comentarios: