29
/es/
es
AIzaSyAYiBZKx7MnpbEhh9jyipgxe19OcubqV5w
April 1, 2024
51834
North America
NAC
false
2
1
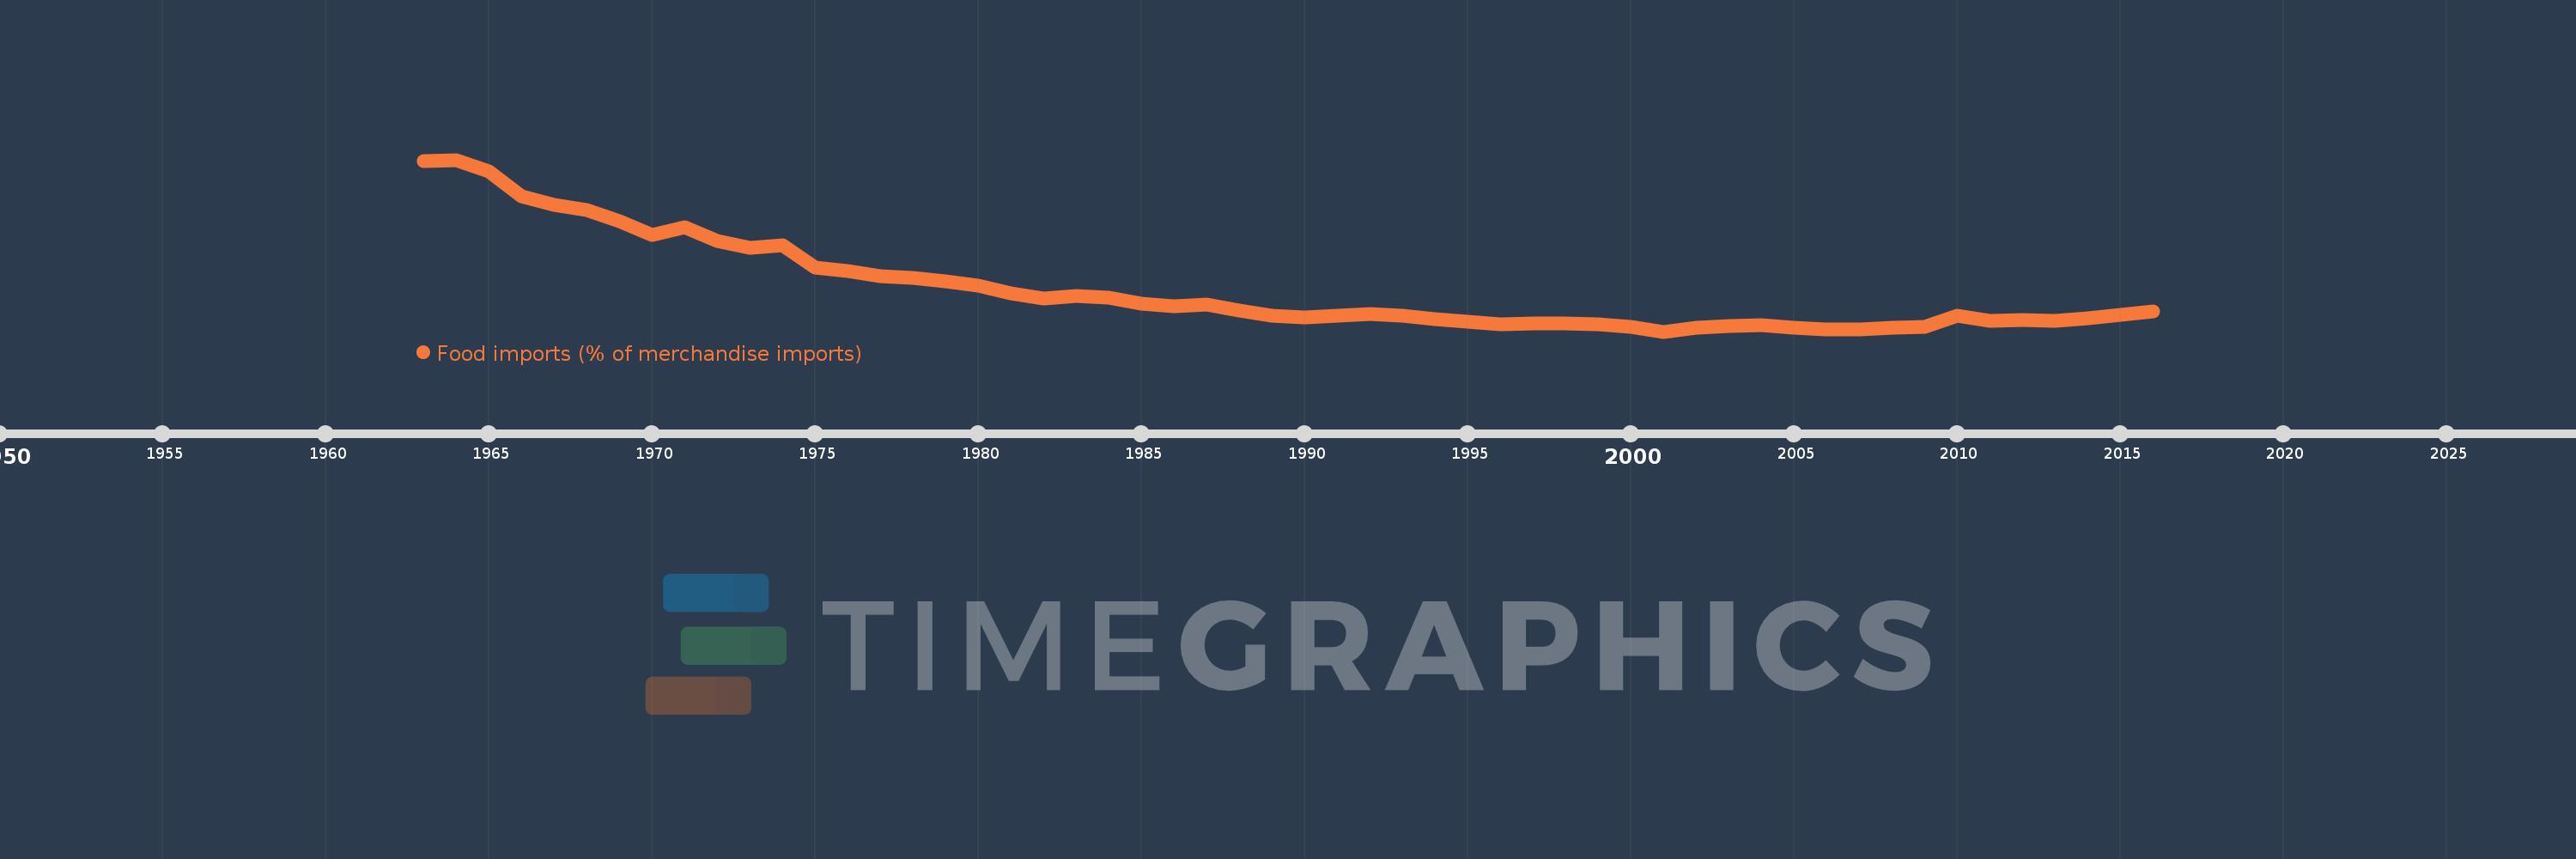
Food imports (% of merchandise imports)
2016,2015,2014,2013,2012,2011,2010,2009,2008,2007,2006,2005,2004,2003,2002,2001,2000,1999,1998,1997,1996,1995,1994,1993,1992,1991,1990,1989,1988,1987,1986,1985,1984,1983,1982,1981,1980,1979,1978,1977,1976,1975,1974,1973,1972,1971,1970,1969,1968,1967,1966,1965,1964,1963
Estas estadísticas en otros países:
AfghanistanAlbaniaAlgeriaAndorraAngolaAntigua and BarbudaArab WorldArgentinaArmeniaArubaAustraliaAustriaAzerbaijanBahamas, TheBahrainBangladeshBarbadosBelarusBelgiumBelizeBeninBermudaBhutanBoliviaBosnia and HerzegovinaBotswanaBrazilBrunei DarussalamBulgariaBurkina FasoBurundiCabo VerdeCambodiaCameroonCanadaCaribbean small statesCayman IslandsCentral African RepublicCentral Europe and the BalticsChadChileChinaColombiaComorosCongo, Dem. Rep.Congo, Rep.Costa RicaCote d'IvoireCroatiaCubaCyprusCzech RepublicDenmarkDjiboutiDominicaDominican RepublicEarly-demographic dividendEast Asia & PacificEast Asia & Pacific (excluding high income)East Asia & Pacific (IDA & IBRD countries)EcuadorEgypt, Arab Rep.El SalvadorEquatorial GuineaEritreaEstoniaEthiopiaEuro areaEurope & Central AsiaEurope & Central Asia (excluding high income)Europe & Central Asia (IDA & IBRD countries)European UnionFaroe IslandsFijiFinlandFragile and conflict affected situationsFranceFrench PolynesiaGabonGambia, TheGeorgiaGermanyGhanaGreeceGreenlandGrenadaGuatemalaGuineaGuinea-BissauGuyanaHaitiHeavily indebted poor countries (HIPC)High incomeHondurasHong Kong SAR, ChinaHungaryIBRD onlyIcelandIDA & IBRD totalIDA blendIDA onlyIDA totalIndiaIndonesiaIran, Islamic Rep.IraqIrelandIsraelItalyJamaicaJapanJordanKazakhstanKenyaKiribatiKorea, Rep.KuwaitKyrgyz RepublicLao PDRLate-demographic dividendLatin America & Caribbean Latin America & Caribbean (excluding high income)Latin America & the Caribbean (IDA & IBRD countries)LatviaLeast developed countries: UN classificationLebanonLesothoLiberiaLibyaLithuaniaLow & middle incomeLow incomeLower middle incomeLuxembourgMacao SAR, ChinaMacedonia, FYRMadagascarMalawiMalaysiaMaldivesMaliMaltaMauritaniaMauritiusMexicoMiddle East & North AfricaMiddle East & North Africa (excluding high income)Middle East & North Africa (IDA & IBRD countries)Middle incomeMoldovaMongoliaMoroccoMozambiqueMyanmarNamibiaNepalNetherlandsNew CaledoniaNew ZealandNicaraguaNigerNigeriaNorth AmericaNorwayOECD membersOmanOther small statesPacific island small statesPakistanPalauPanamaPapua New GuineaParaguayPeruPhilippinesPolandPortugalPost-demographic dividendPre-demographic dividendQatarRomaniaRussian FederationRwandaSamoaSao Tome and PrincipeSaudi ArabiaSenegalSerbiaSeychellesSierra LeoneSingaporeSlovak RepublicSloveniaSmall statesSolomon IslandsSomaliaSouth AfricaSouth AsiaSouth Asia (IDA & IBRD)SpainSri LankaSt. Kitts and NevisSt. LuciaSt. Vincent and the GrenadinesSub-Saharan Africa Sub-Saharan Africa (excluding high income)Sub-Saharan Africa (IDA & IBRD countries)SudanSurinameSwazilandSwedenSwitzerlandSyrian Arab RepublicTajikistanTanzaniaThailandTimor-LesteTogoTongaTrinidad and TobagoTunisiaTurkeyTurkmenistanTurks and Caicos IslandsTuvaluUgandaUkraineUnited Arab EmiratesUnited KingdomUnited StatesUpper middle incomeUruguayVanuatuVenezuela, RBVietnamVirgin Islands (U.S.)WorldYemen, Rep.ZambiaZimbabwe línea de tiempo (timeline):
En esta escala de tiempo se presenta un gráfico de 1963 y 2016 de North America. Los datos de 1962 están ausentes. El número de observaciones reales por fecha: 54.
Fuente (nombre):
Indicadores del desarrollo mundial
Fuente (organización):
World Bank staff estimates from the Comtrade database maintained by the United Nations Statistics Division.
Categorías:
Private Sector, Trade
Se ha actualizado:
23 abr 2017 año
Los indicadores de los cambios de valor en los últimos años
Mínimo:
4.25
1 ene 2001 año
Máximo:
21.636
1 ene 1964 año
A la fecha de observación
Valor
Cambio absoluto
El cambio con respecto al valor anterior
1 ene 1963 año
21.534
+21.534
0.0%
1 ene 1964 año
21.636
+0.102
0.47%
1 ene 1965 año
20.473
-1.163
-5.38%
1 ene 1966 año
17.947
-2.526
-12.34%
1 ene 1967 año
17.09
-0.857
-4.78%
1 ene 1968 año
16.578
-0.512
-3.0%
1 ene 1969 año
15.379
-1.199
-7.23%
1 ene 1970 año
14.035
-1.344
-8.74%
1 ene 1971 año
14.853
+0.818
5.82%
1 ene 1972 año
13.42
-1.433
-9.65%
1 ene 1973 año
12.697
-0.723
-5.39%
1 ene 1974 año
12.946
+0.25
1.97%
1 ene 1975 año
10.755
-2.192
-16.93%
1 ene 1976 año
10.411
-0.344
-3.2%
1 ene 1977 año
9.843
-0.568
-5.46%
1 ene 1978 año
9.669
-0.173
-1.76%
1 ene 1979 año
9.371
-0.298
-3.08%
1 ene 1980 año
8.865
-0.506
-5.4%
1 ene 1981 año
8.095
-0.77
-8.69%
1 ene 1982 año
7.6
-0.495
-6.11%
1 ene 1983 año
7.84
+0.24
3.15%
1 ene 1984 año
7.708
-0.132
-1.68%
1 ene 1985 año
7.068
-0.64
-8.31%
1 ene 1986 año
6.852
-0.216
-3.05%
1 ene 1987 año
6.983
+0.131
1.91%
1 ene 1988 año
6.407
-0.576
-8.25%
1 ene 1989 año
5.896
-0.512
-7.98%
1 ene 1990 año
5.726
-0.169
-2.87%
1 ene 1991 año
5.874
+0.148
2.58%
1 ene 1992 año
6.014
+0.14
2.39%
1 ene 1993 año
5.846
-0.168
-2.8%
1 ene 1994 año
5.505
-0.341
-5.83%
1 ene 1995 año
5.211
-0.294
-5.35%
1 ene 1996 año
4.948
-0.262
-5.03%
1 ene 1997 año
5.085
+0.136
2.75%
1 ene 1998 año
5.093
+0.009
0.17%
1 ene 1999 año
5.008
-0.086
-1.68%
1 ene 2000 año
4.719
-0.288
-5.76%
1 ene 2001 año
4.25
-0.47
-9.95%
1 ene 2002 año
4.622
+0.373
8.77%
1 ene 2003 año
4.844
+0.222
4.79%
1 ene 2004 año
4.922
+0.078
1.62%
1 ene 2005 año
4.625
-0.297
-6.04%
1 ene 2006 año
4.456
-0.169
-3.66%
1 ene 2007 año
4.463
+0.007
0.15%
1 ene 2008 año
4.666
+0.203
4.56%
1 ene 2009 año
4.76
+0.094
2.02%
1 ene 2010 año
5.894
+1.133
23.81%
1 ene 2011 año
5.375
-0.518
-8.79%
1 ene 2012 año
5.45
+0.075
1.39%
1 ene 2013 año
5.358
-0.092
-1.69%
1 ene 2014 año
5.594
+0.236
4.41%
1 ene 2015 año
5.946
+0.351
6.28%
1 ene 2016 año
6.287
+0.342
5.75%
Ranking de los países por los datos estadísticos actuales


Comentarios: