29
/es/
es
AIzaSyAYiBZKx7MnpbEhh9jyipgxe19OcubqV5w
April 1, 2024
112225
Costa Rica
CRI
true
2
1
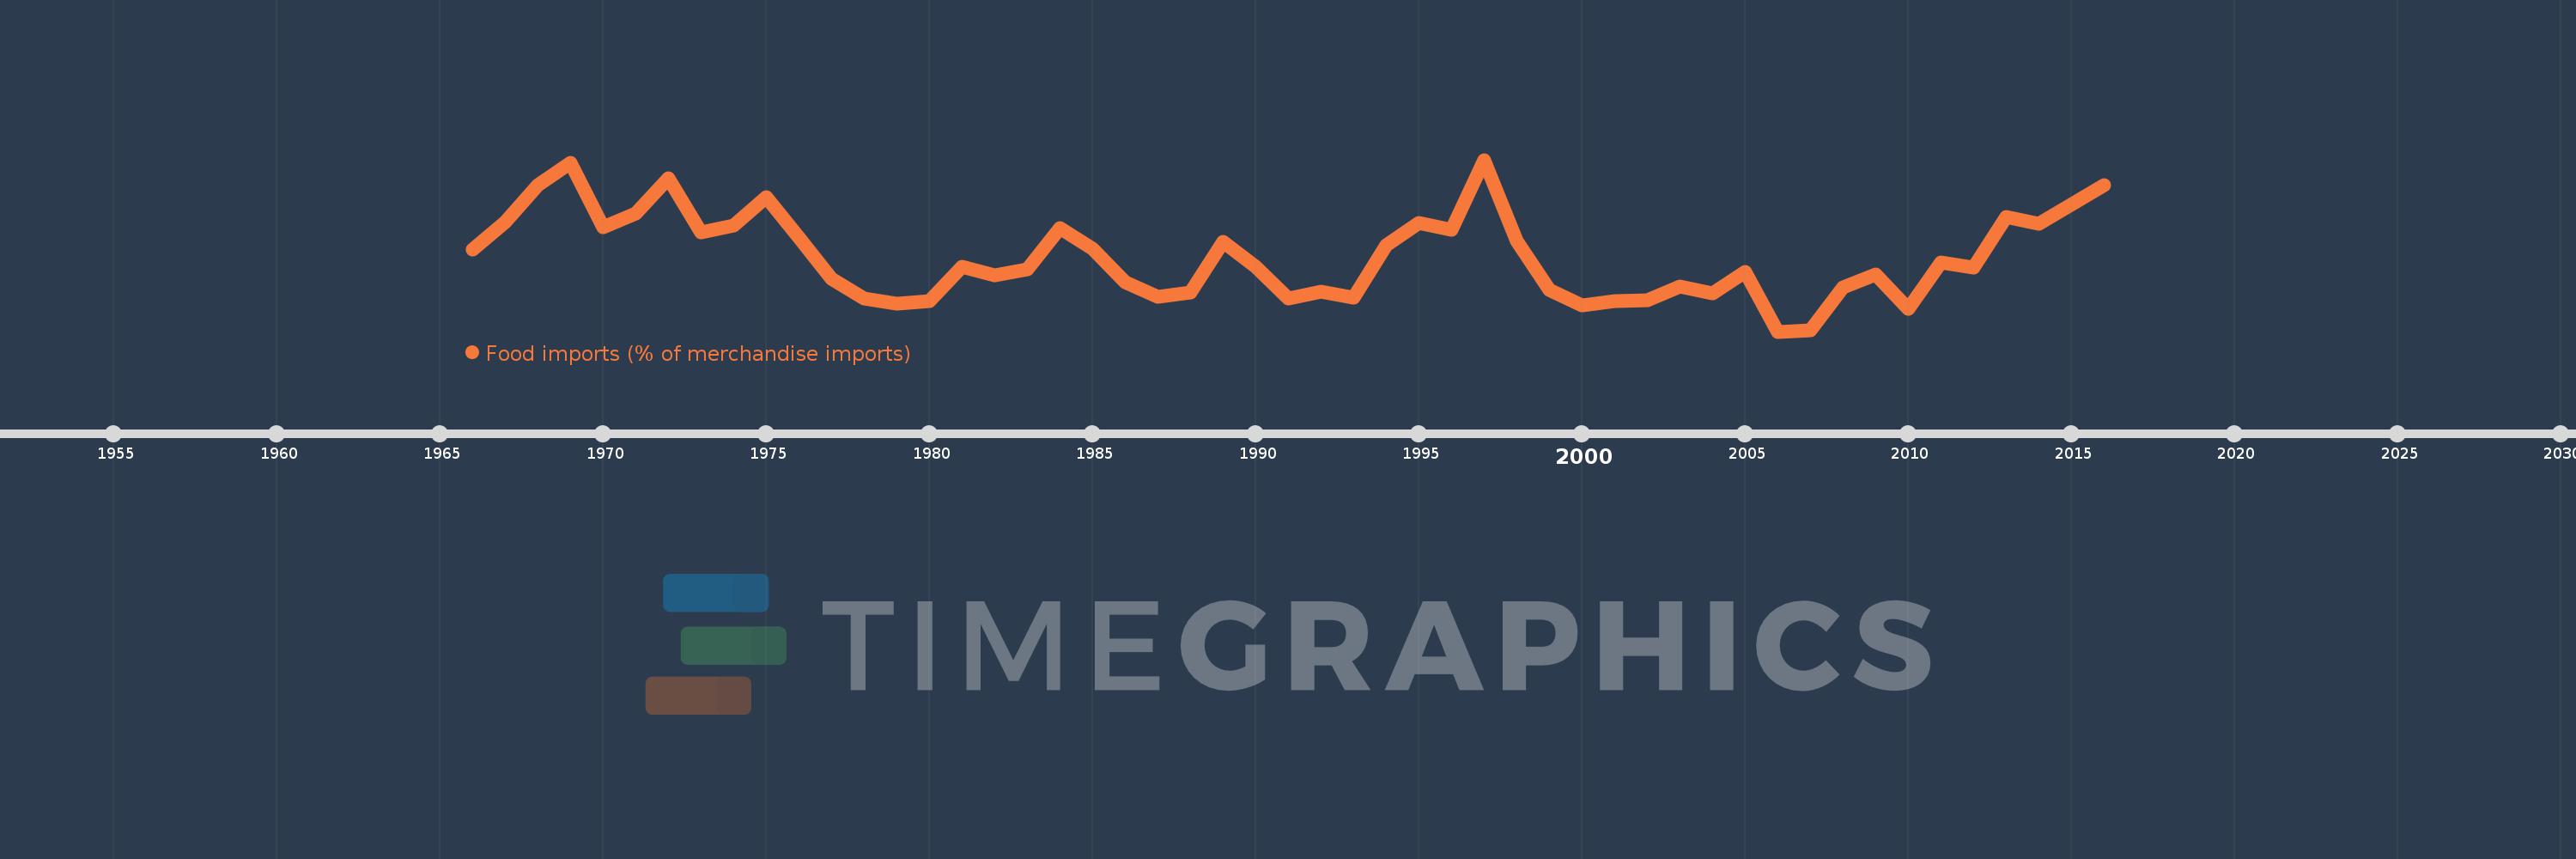
Food imports (% of merchandise imports)
2016,2014,2013,2012,2011,2010,2009,2008,2007,2006,2005,2004,2003,2002,2001,2000,1999,1998,1997,1996,1995,1994,1993,1992,1991,1990,1989,1988,1987,1986,1985,1984,1983,1982,1981,1980,1979,1978,1977,1976,1975,1974,1973,1972,1971,1970,1969,1968,1967,1966
Estas estadísticas en otros países:
AfghanistanAlbaniaAlgeriaAndorraAngolaAntigua and BarbudaArab WorldArgentinaArmeniaArubaAustraliaAustriaAzerbaijanBahamas, TheBahrainBangladeshBarbadosBelarusBelgiumBelizeBeninBermudaBhutanBoliviaBosnia and HerzegovinaBotswanaBrazilBrunei DarussalamBulgariaBurkina FasoBurundiCabo VerdeCambodiaCameroonCanadaCaribbean small statesCayman IslandsCentral African RepublicCentral Europe and the BalticsChadChileChinaColombiaComorosCongo, Dem. Rep.Congo, Rep.Costa RicaCote d'IvoireCroatiaCubaCyprusCzech RepublicDenmarkDjiboutiDominicaDominican RepublicEarly-demographic dividendEast Asia & PacificEast Asia & Pacific (excluding high income)East Asia & Pacific (IDA & IBRD countries)EcuadorEgypt, Arab Rep.El SalvadorEquatorial GuineaEritreaEstoniaEthiopiaEuro areaEurope & Central AsiaEurope & Central Asia (excluding high income)Europe & Central Asia (IDA & IBRD countries)European UnionFaroe IslandsFijiFinlandFragile and conflict affected situationsFranceFrench PolynesiaGabonGambia, TheGeorgiaGermanyGhanaGreeceGreenlandGrenadaGuatemalaGuineaGuinea-BissauGuyanaHaitiHeavily indebted poor countries (HIPC)High incomeHondurasHong Kong SAR, ChinaHungaryIBRD onlyIcelandIDA & IBRD totalIDA blendIDA onlyIDA totalIndiaIndonesiaIran, Islamic Rep.IraqIrelandIsraelItalyJamaicaJapanJordanKazakhstanKenyaKiribatiKorea, Rep.KuwaitKyrgyz RepublicLao PDRLate-demographic dividendLatin America & Caribbean Latin America & Caribbean (excluding high income)Latin America & the Caribbean (IDA & IBRD countries)LatviaLeast developed countries: UN classificationLebanonLesothoLiberiaLibyaLithuaniaLow & middle incomeLow incomeLower middle incomeLuxembourgMacao SAR, ChinaMacedonia, FYRMadagascarMalawiMalaysiaMaldivesMaliMaltaMauritaniaMauritiusMexicoMiddle East & North AfricaMiddle East & North Africa (excluding high income)Middle East & North Africa (IDA & IBRD countries)Middle incomeMoldovaMongoliaMoroccoMozambiqueMyanmarNamibiaNepalNetherlandsNew CaledoniaNew ZealandNicaraguaNigerNigeriaNorth AmericaNorwayOECD membersOmanOther small statesPacific island small statesPakistanPalauPanamaPapua New GuineaParaguayPeruPhilippinesPolandPortugalPost-demographic dividendPre-demographic dividendQatarRomaniaRussian FederationRwandaSamoaSao Tome and PrincipeSaudi ArabiaSenegalSerbiaSeychellesSierra LeoneSingaporeSlovak RepublicSloveniaSmall statesSolomon IslandsSomaliaSouth AfricaSouth AsiaSouth Asia (IDA & IBRD)SpainSri LankaSt. Kitts and NevisSt. LuciaSt. Vincent and the GrenadinesSub-Saharan Africa Sub-Saharan Africa (excluding high income)Sub-Saharan Africa (IDA & IBRD countries)SudanSurinameSwazilandSwedenSwitzerlandSyrian Arab RepublicTajikistanTanzaniaThailandTimor-LesteTogoTongaTrinidad and TobagoTunisiaTurkeyTurkmenistanTurks and Caicos IslandsTuvaluUgandaUkraineUnited Arab EmiratesUnited KingdomUnited StatesUpper middle incomeUruguayVanuatuVenezuela, RBVietnamVirgin Islands (U.S.)WorldYemen, Rep.ZambiaZimbabwe línea de tiempo (timeline):
En esta escala de tiempo se presenta un gráfico de 1966 y 2016 de Costa Rica. Los datos de 1965 están ausentes. El número de observaciones reales por fecha: 50.
Fuente (nombre):
Indicadores del desarrollo mundial
Fuente (organización):
World Bank staff estimates from the Comtrade database maintained by the United Nations Statistics Division.
Categorías:
Private Sector, Trade
Se ha actualizado:
23 abr 2017 año
Los indicadores de los cambios de valor en los últimos años
Mínimo:
6.301
1 ene 2006 año
Máximo:
12.937
1 ene 1997 año
A la fecha de observación
Valor
Cambio absoluto
El cambio con respecto al valor anterior
1 ene 1966 año
9.463
+9.463
0.0%
1 ene 1967 año
10.525
+1.062
11.23%
1 ene 1968 año
11.942
+1.417
13.47%
1 ene 1969 año
12.817
+0.875
7.33%
1 ene 1970 año
10.343
-2.474
-19.3%
1 ene 1971 año
10.879
+0.536
5.18%
1 ene 1972 año
12.221
+1.342
12.34%
1 ene 1973 año
10.141
-2.08
-17.02%
1 ene 1974 año
10.394
+0.253
2.49%
1 ene 1975 año
11.482
+1.088
10.47%
1 ene 1976 año
9.921
-1.56
-13.59%
1 ene 1977 año
8.325
-1.596
-16.09%
1 ene 1978 año
7.583
-0.742
-8.92%
1 ene 1979 año
7.387
-0.196
-2.59%
1 ene 1980 año
7.481
+0.093
1.27%
1 ene 1981 año
8.807
+1.327
17.73%
1 ene 1982 año
8.476
-0.331
-3.76%
1 ene 1983 año
8.708
+0.232
2.74%
1 ene 1984 año
10.297
+1.589
18.25%
1 ene 1985 año
9.517
-0.78
-7.57%
1 ene 1986 año
8.224
-1.293
-13.59%
1 ene 1987 año
7.661
-0.563
-6.85%
1 ene 1988 año
7.803
+0.143
1.86%
1 ene 1989 año
9.754
+1.95
24.99%
1 ene 1990 año
8.801
-0.953
-9.77%
1 ene 1991 año
7.581
-1.221
-13.87%
1 ene 1992 año
7.832
+0.252
3.32%
1 ene 1993 año
7.618
-0.214
-2.74%
1 ene 1994 año
9.635
+2.017
26.48%
1 ene 1995 año
10.489
+0.853
8.86%
1 ene 1996 año
10.245
-0.244
-2.32%
1 ene 1997 año
12.937
+2.692
26.27%
1 ene 1998 año
9.794
-3.143
-24.3%
1 ene 1999 año
7.91
-1.883
-19.23%
1 ene 2000 año
7.318
-0.592
-7.49%
1 ene 2001 año
7.468
+0.15
2.05%
1 ene 2002 año
7.526
+0.057
0.77%
1 ene 2003 año
8.039
+0.513
6.82%
1 ene 2004 año
7.765
-0.274
-3.4%
1 ene 2005 año
8.606
+0.841
10.83%
1 ene 2006 año
6.301
-2.305
-26.79%
1 ene 2007 año
6.341
+0.04
0.64%
1 ene 2008 año
8.007
+1.666
26.27%
1 ene 2009 año
8.514
+0.508
6.34%
1 ene 2010 año
7.17
-1.344
-15.79%
1 ene 2011 año
8.977
+1.807
25.2%
1 ene 2012 año
8.759
-0.218
-2.43%
1 ene 2013 año
10.738
+1.979
22.59%
1 ene 2014 año
10.453
-0.285
-2.65%
1 ene 2016 año
11.964
+1.511
14.46%
Ranking de los países por los datos estadísticos actuales


Comentarios: