29
/es/
es
AIzaSyAYiBZKx7MnpbEhh9jyipgxe19OcubqV5w
April 1, 2024
48073
Middle East & North Africa
MEA
false
2
1
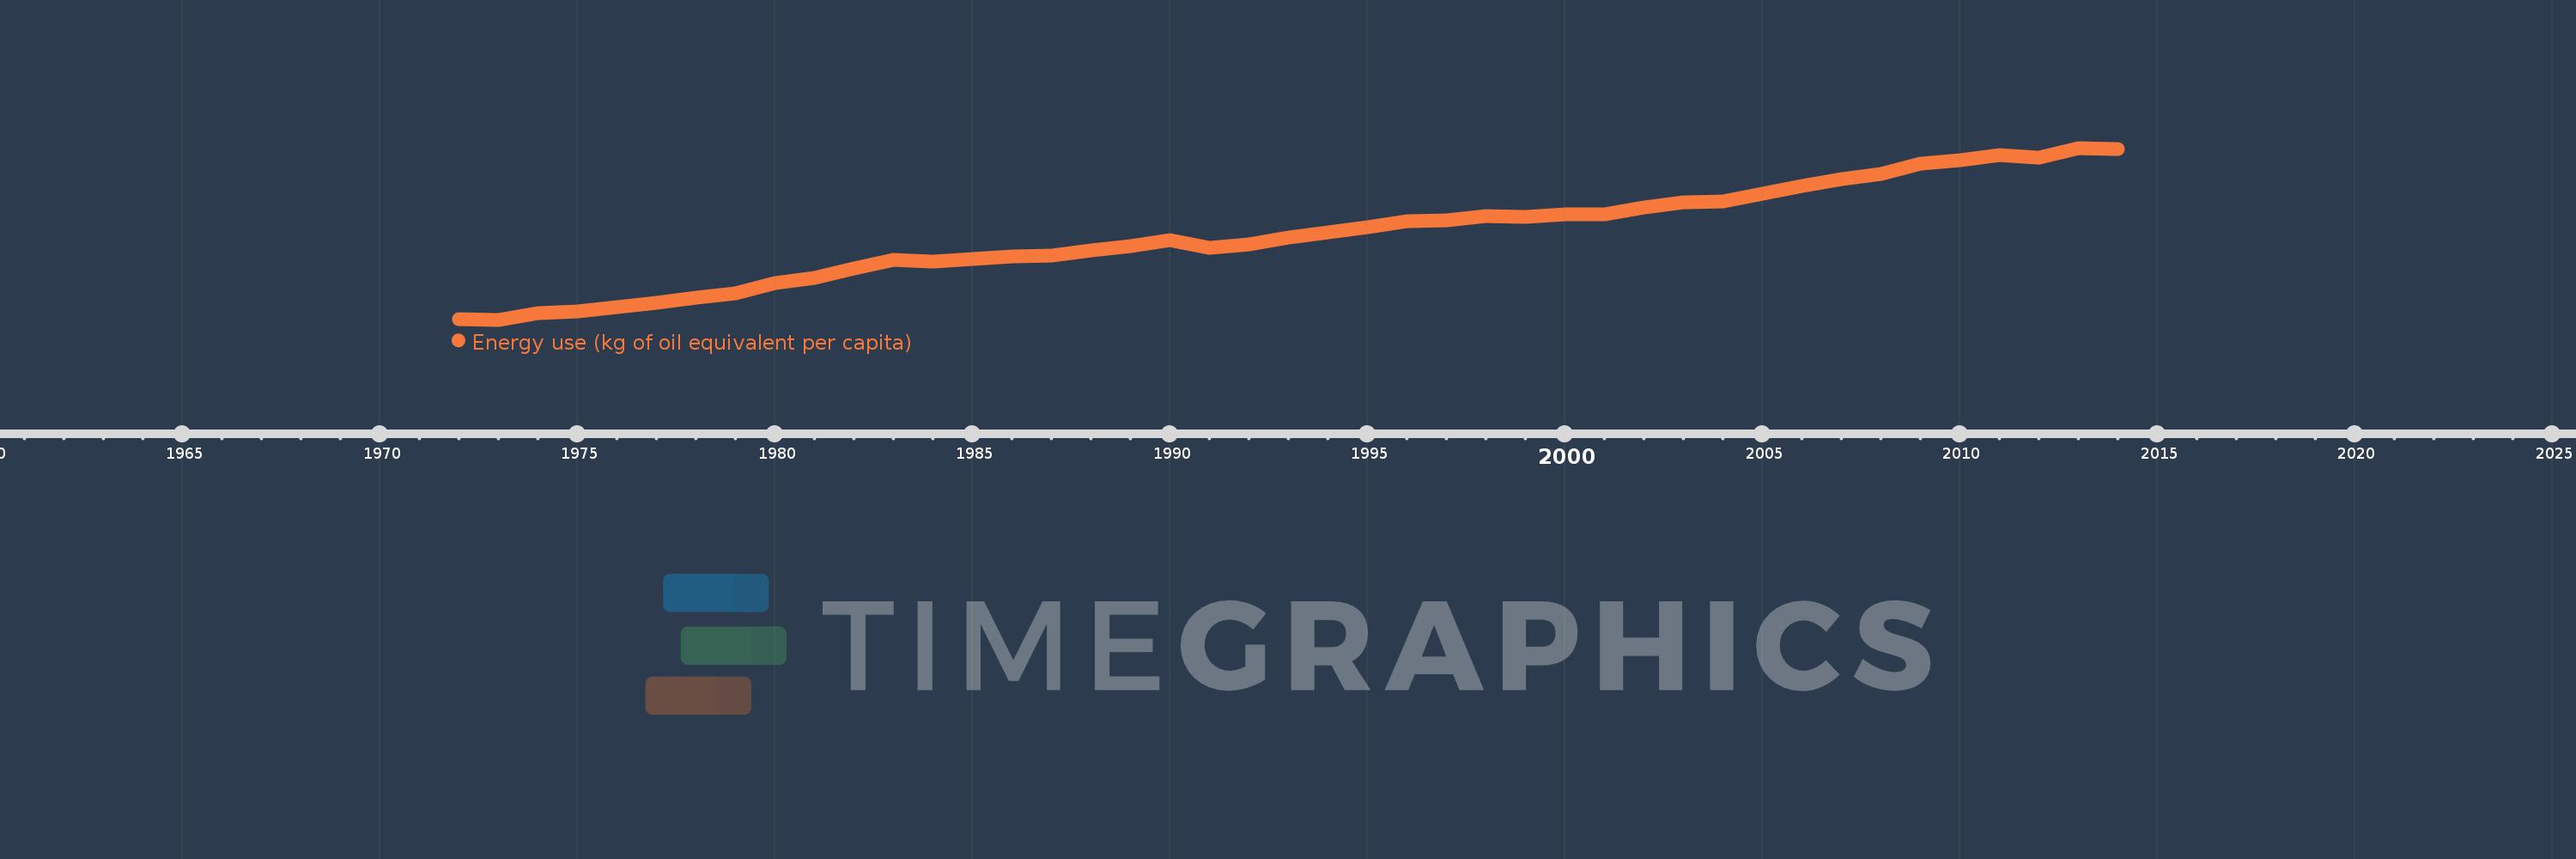
Energy use (kg of oil equivalent per capita)
2014,2013,2012,2011,2010,2009,2008,2007,2006,2005,2004,2003,2002,2001,2000,1999,1998,1997,1996,1995,1994,1993,1992,1991,1990,1989,1988,1987,1986,1985,1984,1983,1982,1981,1980,1979,1978,1977,1976,1975,1974,1973,1972
Estas estadísticas en otros países:
AlbaniaAlgeriaAngolaAntigua and BarbudaArab WorldArgentinaArmeniaAustraliaAustriaAzerbaijanBahamas, TheBahrainBangladeshBarbadosBelarusBelgiumBelizeBeninBhutanBoliviaBosnia and HerzegovinaBotswanaBrazilBrunei DarussalamBulgariaCabo VerdeCambodiaCameroonCanadaCaribbean small statesCentral Europe and the BalticsChileChinaColombiaComorosCongo, Dem. Rep.Congo, Rep.Costa RicaCote d'IvoireCroatiaCubaCuracaoCyprusCzech RepublicDenmarkDjiboutiDominicaDominican RepublicEarly-demographic dividendEast Asia & PacificEast Asia & Pacific (excluding high income)East Asia & Pacific (IDA & IBRD countries)EcuadorEgypt, Arab Rep.El SalvadorEquatorial GuineaEritreaEstoniaEthiopiaEuro areaEurope & Central AsiaEurope & Central Asia (excluding high income)Europe & Central Asia (IDA & IBRD countries)European UnionFijiFinlandFragile and conflict affected situationsFranceGabonGambia, TheGeorgiaGermanyGhanaGibraltarGreeceGrenadaGuatemalaGuinea-BissauGuyanaHaitiHeavily indebted poor countries (HIPC)High incomeHondurasHong Kong SAR, ChinaHungaryIBRD onlyIcelandIDA & IBRD totalIDA blendIDA onlyIDA totalIndiaIndonesiaIran, Islamic Rep.IraqIrelandIsraelItalyJamaicaJapanJordanKazakhstanKenyaKiribatiKorea, Dem. People’s Rep.Korea, Rep.KosovoKuwaitKyrgyz RepublicLate-demographic dividendLatin America & Caribbean Latin America & Caribbean (excluding high income)Latin America & the Caribbean (IDA & IBRD countries)LatviaLeast developed countries: UN classificationLebanonLesothoLibyaLithuaniaLow & middle incomeLower middle incomeLuxembourgMacedonia, FYRMalaysiaMaldivesMaltaMarshall IslandsMauritiusMexicoMiddle East & North AfricaMiddle East & North Africa (excluding high income)Middle East & North Africa (IDA & IBRD countries)Middle incomeMoldovaMongoliaMontenegroMoroccoMozambiqueMyanmarNamibiaNepalNetherlandsNew ZealandNicaraguaNigerNigeriaNorth AmericaNorwayOECD membersOmanOther small statesPacific island small statesPakistanPalauPanamaParaguayPeruPhilippinesPolandPortugalPost-demographic dividendPre-demographic dividendQatarRomaniaRussian FederationSamoaSao Tome and PrincipeSaudi ArabiaSenegalSerbiaSeychellesSingaporeSlovak RepublicSloveniaSmall statesSolomon IslandsSouth AfricaSouth AsiaSouth Asia (IDA & IBRD)South SudanSpainSri LankaSt. Kitts and NevisSt. LuciaSt. Vincent and the GrenadinesSub-Saharan Africa Sub-Saharan Africa (excluding high income)Sub-Saharan Africa (IDA & IBRD countries)SudanSurinameSwazilandSwedenSwitzerlandSyrian Arab RepublicTajikistanTanzaniaThailandTimor-LesteTogoTongaTrinidad and TobagoTunisiaTurkeyTurkmenistanUkraineUnited Arab EmiratesUnited KingdomUnited StatesUpper middle incomeUruguayUzbekistanVanuatuVenezuela, RBVietnamWorldYemen, Rep.ZambiaZimbabwe línea de tiempo (timeline):
En esta escala de tiempo se presenta un gráfico de 1972 y 2014 de Middle East & North Africa. Los datos de 1971 están ausentes. El número de observaciones reales por fecha: 43.
Fuente (nombre):
Indicadores del desarrollo mundial
Fuente (organización):
IEA Statistics © OECD/IEA 2014 (http://www.iea.org/stats/index.asp), subject to https://www.iea.org/t&c/termsandconditions/
Categorías:
Energy & Mining, Climate Change
Se ha actualizado:
23 abr 2017 año
Los indicadores de los cambios de valor en los últimos años
Mínimo:
463.067
1 ene 1973 año
Máximo:
2.204 mil
1 ene 2013 año
A la fecha de observación
Valor
Cambio absoluto
El cambio con respecto al valor anterior
1 ene 1972 año
466.077
+466.077
0.0%
1 ene 1973 año
463.067
-3.01
-0.65%
1 ene 1974 año
528.471
+65.404
14.12%
1 ene 1975 año
551.074
+22.603
4.28%
1 ene 1976 año
587.695
+36.62
6.65%
1 ene 1977 año
636.645
+48.951
8.33%
1 ene 1978 año
682.463
+45.817
7.2%
1 ene 1979 año
727.408
+44.946
6.59%
1 ene 1980 año
835.41
+108.002
14.85%
1 ene 1981 año
885.494
+50.084
6.0%
1 ene 1982 año
978.367
+92.873
10.49%
1 ene 1983 año
1.069 mil
+90.349
9.23%
1 ene 1984 año
1.055 mil
-13.219
-1.24%
1 ene 1985 año
1.074 mil
+18.624
1.76%
1 ene 1986 año
1.1 mil
+26.317
2.45%
1 ene 1987 año
1.116 mil
+15.939
1.45%
1 ene 1988 año
1.162 mil
+45.877
4.11%
1 ene 1989 año
1.212 mil
+50.105
4.31%
1 ene 1990 año
1.269 mil
+56.314
4.65%
1 ene 1991 año
1.193 mil
-75.898
-5.98%
1 ene 1992 año
1.229 mil
+36.366
3.05%
1 ene 1993 año
1.294 mil
+65.162
5.3%
1 ene 1994 año
1.346 mil
+51.326
3.97%
1 ene 1995 año
1.402 mil
+56.168
4.17%
1 ene 1996 año
1.46 mil
+57.925
4.13%
1 ene 1997 año
1.468 mil
+8.06
0.55%
1 ene 1998 año
1.515 mil
+47.06
3.21%
1 ene 1999 año
1.509 mil
-5.632
-0.37%
1 ene 2000 año
1.533 mil
+23.735
1.57%
1 ene 2001 año
1.531 mil
-1.602
-0.1%
1 ene 2002 año
1.603 mil
+71.345
4.66%
1 ene 2003 año
1.651 mil
+48.259
3.01%
1 ene 2004 año
1.661 mil
+9.728
0.59%
1 ene 2005 año
1.736 mil
+75.488
4.55%
1 ene 2006 año
1.82 mil
+84.304
4.86%
1 ene 2007 año
1.885 mil
+64.144
3.52%
1 ene 2008 año
1.94 mil
+55.038
2.92%
1 ene 2009 año
2.046 mil
+106.533
5.49%
1 ene 2010 año
2.083 mil
+37.069
1.81%
1 ene 2011 año
2.133 mil
+49.472
2.37%
1 ene 2012 año
2.104 mil
-28.346
-1.33%
1 ene 2013 año
2.204 mil
+99.401
4.72%
1 ene 2014 año
2.193 mil
-10.309
-0.47%
Ranking de los países por los datos estadísticos actuales


Comentarios: