29
/es/
es
AIzaSyAYiBZKx7MnpbEhh9jyipgxe19OcubqV5w
April 1, 2024
206662
Nepal
NPL
true
2
1
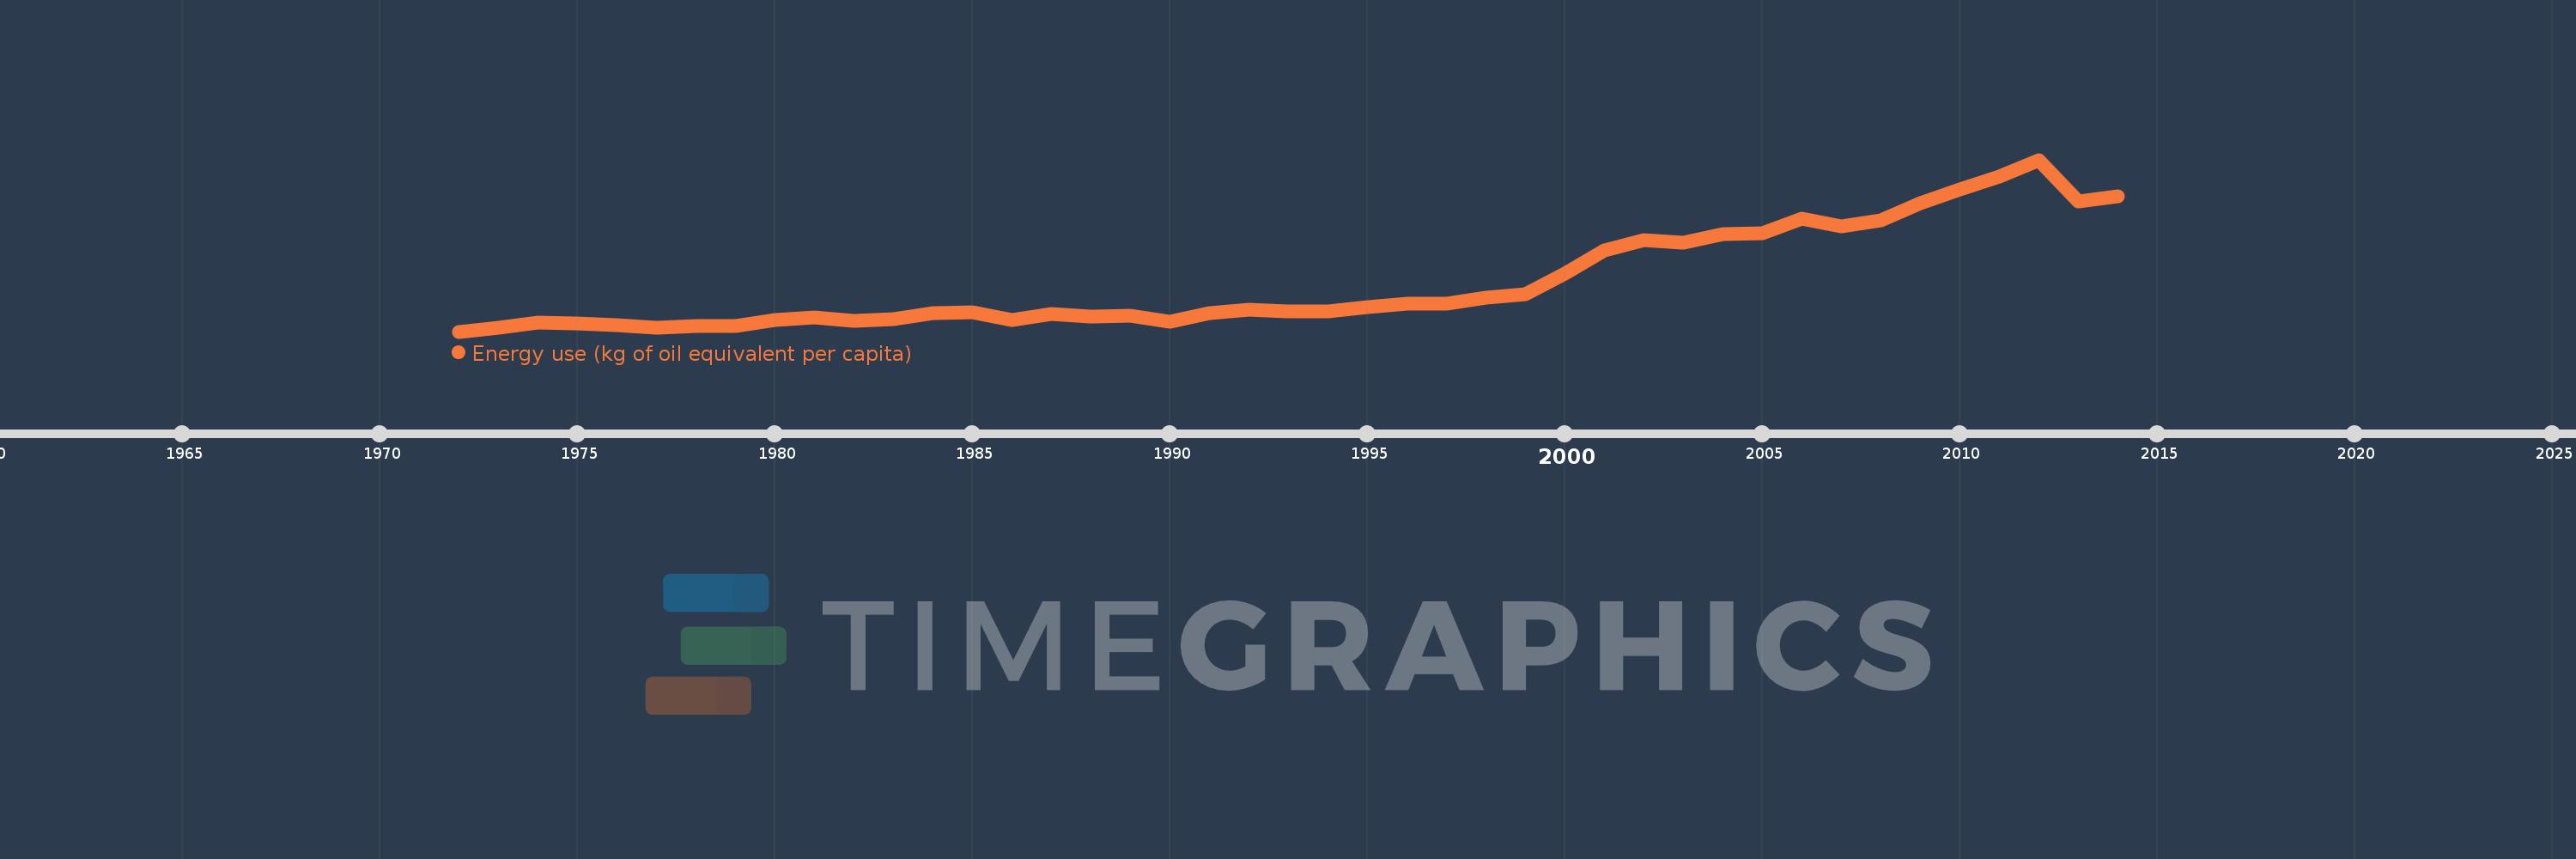
Energy use (kg of oil equivalent per capita)
2014,2013,2012,2011,2010,2009,2008,2007,2006,2005,2004,2003,2002,2001,2000,1999,1998,1997,1996,1995,1994,1993,1992,1991,1990,1989,1988,1987,1986,1985,1984,1983,1982,1981,1980,1979,1978,1977,1976,1975,1974,1973,1972
Estas estadísticas en otros países:
AlbaniaAlgeriaAngolaAntigua and BarbudaArab WorldArgentinaArmeniaAustraliaAustriaAzerbaijanBahamas, TheBahrainBangladeshBarbadosBelarusBelgiumBelizeBeninBhutanBoliviaBosnia and HerzegovinaBotswanaBrazilBrunei DarussalamBulgariaCabo VerdeCambodiaCameroonCanadaCaribbean small statesCentral Europe and the BalticsChileChinaColombiaComorosCongo, Dem. Rep.Congo, Rep.Costa RicaCote d'IvoireCroatiaCubaCuracaoCyprusCzech RepublicDenmarkDjiboutiDominicaDominican RepublicEarly-demographic dividendEast Asia & PacificEast Asia & Pacific (excluding high income)East Asia & Pacific (IDA & IBRD countries)EcuadorEgypt, Arab Rep.El SalvadorEquatorial GuineaEritreaEstoniaEthiopiaEuro areaEurope & Central AsiaEurope & Central Asia (excluding high income)Europe & Central Asia (IDA & IBRD countries)European UnionFijiFinlandFragile and conflict affected situationsFranceGabonGambia, TheGeorgiaGermanyGhanaGibraltarGreeceGrenadaGuatemalaGuinea-BissauGuyanaHaitiHeavily indebted poor countries (HIPC)High incomeHondurasHong Kong SAR, ChinaHungaryIBRD onlyIcelandIDA & IBRD totalIDA blendIDA onlyIDA totalIndiaIndonesiaIran, Islamic Rep.IraqIrelandIsraelItalyJamaicaJapanJordanKazakhstanKenyaKiribatiKorea, Dem. People’s Rep.Korea, Rep.KosovoKuwaitKyrgyz RepublicLate-demographic dividendLatin America & Caribbean Latin America & Caribbean (excluding high income)Latin America & the Caribbean (IDA & IBRD countries)LatviaLeast developed countries: UN classificationLebanonLesothoLibyaLithuaniaLow & middle incomeLower middle incomeLuxembourgMacedonia, FYRMalaysiaMaldivesMaltaMarshall IslandsMauritiusMexicoMiddle East & North AfricaMiddle East & North Africa (excluding high income)Middle East & North Africa (IDA & IBRD countries)Middle incomeMoldovaMongoliaMontenegroMoroccoMozambiqueMyanmarNamibiaNepalNetherlandsNew ZealandNicaraguaNigerNigeriaNorth AmericaNorwayOECD membersOmanOther small statesPacific island small statesPakistanPalauPanamaParaguayPeruPhilippinesPolandPortugalPost-demographic dividendPre-demographic dividendQatarRomaniaRussian FederationSamoaSao Tome and PrincipeSaudi ArabiaSenegalSerbiaSeychellesSingaporeSlovak RepublicSloveniaSmall statesSolomon IslandsSouth AfricaSouth AsiaSouth Asia (IDA & IBRD)South SudanSpainSri LankaSt. Kitts and NevisSt. LuciaSt. Vincent and the GrenadinesSub-Saharan Africa Sub-Saharan Africa (excluding high income)Sub-Saharan Africa (IDA & IBRD countries)SudanSurinameSwazilandSwedenSwitzerlandSyrian Arab RepublicTajikistanTanzaniaThailandTimor-LesteTogoTongaTrinidad and TobagoTunisiaTurkeyTurkmenistanUkraineUnited Arab EmiratesUnited KingdomUnited StatesUpper middle incomeUruguayUzbekistanVanuatuVenezuela, RBVietnamWorldYemen, Rep.ZambiaZimbabwe línea de tiempo (timeline):
En esta escala de tiempo se presenta un gráfico de 1972 y 2014 de Nepal. Los datos de 1971 están ausentes. El número de observaciones reales por fecha: 43.
Fuente (nombre):
Indicadores del desarrollo mundial
Fuente (organización):
IEA Statistics © OECD/IEA 2014 (http://www.iea.org/stats/index.asp), subject to https://www.iea.org/t&c/termsandconditions/
Categorías:
Energy & Mining, Climate Change
Se ha actualizado:
23 abr 2017 año
Los indicadores de los cambios de valor en los últimos años
Mínimo:
299.018
1 ene 1972 año
Máximo:
388.849
1 ene 2012 año
A la fecha de observación
Valor
Cambio absoluto
El cambio con respecto al valor anterior
1 ene 1972 año
299.018
+299.018
0.0%
1 ene 1973 año
300.973
+1.955
0.65%
1 ene 1974 año
303.677
+2.705
0.9%
1 ene 1975 año
303.262
-0.415
-0.14%
1 ene 1976 año
302.358
-0.904
-0.3%
1 ene 1977 año
301.164
-1.194
-0.39%
1 ene 1978 año
302.066
+0.901
0.3%
1 ene 1979 año
301.944
-0.121
-0.04%
1 ene 1980 año
305.078
+3.134
1.04%
1 ene 1981 año
306.362
+1.284
0.42%
1 ene 1982 año
304.539
-1.822
-0.59%
1 ene 1983 año
305.747
+1.207
0.4%
1 ene 1984 año
308.515
+2.768
0.91%
1 ene 1985 año
309.066
+0.551
0.18%
1 ene 1986 año
304.861
-4.205
-1.36%
1 ene 1987 año
308.134
+3.273
1.07%
1 ene 1988 año
307.065
-1.069
-0.35%
1 ene 1989 año
307.336
+0.271
0.09%
1 ene 1990 año
304.26
-3.076
-1.0%
1 ene 1991 año
308.893
+4.633
1.52%
1 ene 1992 año
310.681
+1.789
0.58%
1 ene 1993 año
309.745
-0.936
-0.3%
1 ene 1994 año
309.36
-0.385
-0.12%
1 ene 1995 año
311.938
+2.578
0.83%
1 ene 1996 año
313.764
+1.826
0.59%
1 ene 1997 año
313.803
+0.039
0.01%
1 ene 1998 año
316.822
+3.019
0.96%
1 ene 1999 año
318.354
+1.532
0.48%
1 ene 2000 año
329.409
+11.055
3.47%
1 ene 2001 año
341.519
+12.11
3.68%
1 ene 2002 año
346.904
+5.384
1.58%
1 ene 2003 año
345.371
-1.533
-0.44%
1 ene 2004 año
350.115
+4.744
1.37%
1 ene 2005 año
350.52
+0.405
0.12%
1 ene 2006 año
358.007
+7.486
2.14%
1 ene 2007 año
353.993
-4.013
-1.12%
1 ene 2008 año
357.132
+3.138
0.89%
1 ene 2009 año
365.954
+8.822
2.47%
1 ene 2010 año
373.216
+7.262
1.98%
1 ene 2011 año
379.922
+6.706
1.8%
1 ene 2012 año
388.849
+8.927
2.35%
1 ene 2013 año
367.265
-21.584
-5.55%
1 ene 2014 año
369.679
+2.414
0.66%
Ranking de los países por los datos estadísticos actuales


Comentarios: