29
/es/
es
AIzaSyAYiBZKx7MnpbEhh9jyipgxe19OcubqV5w
April 1, 2024
47446
Lower middle income
LMC
false
2
1
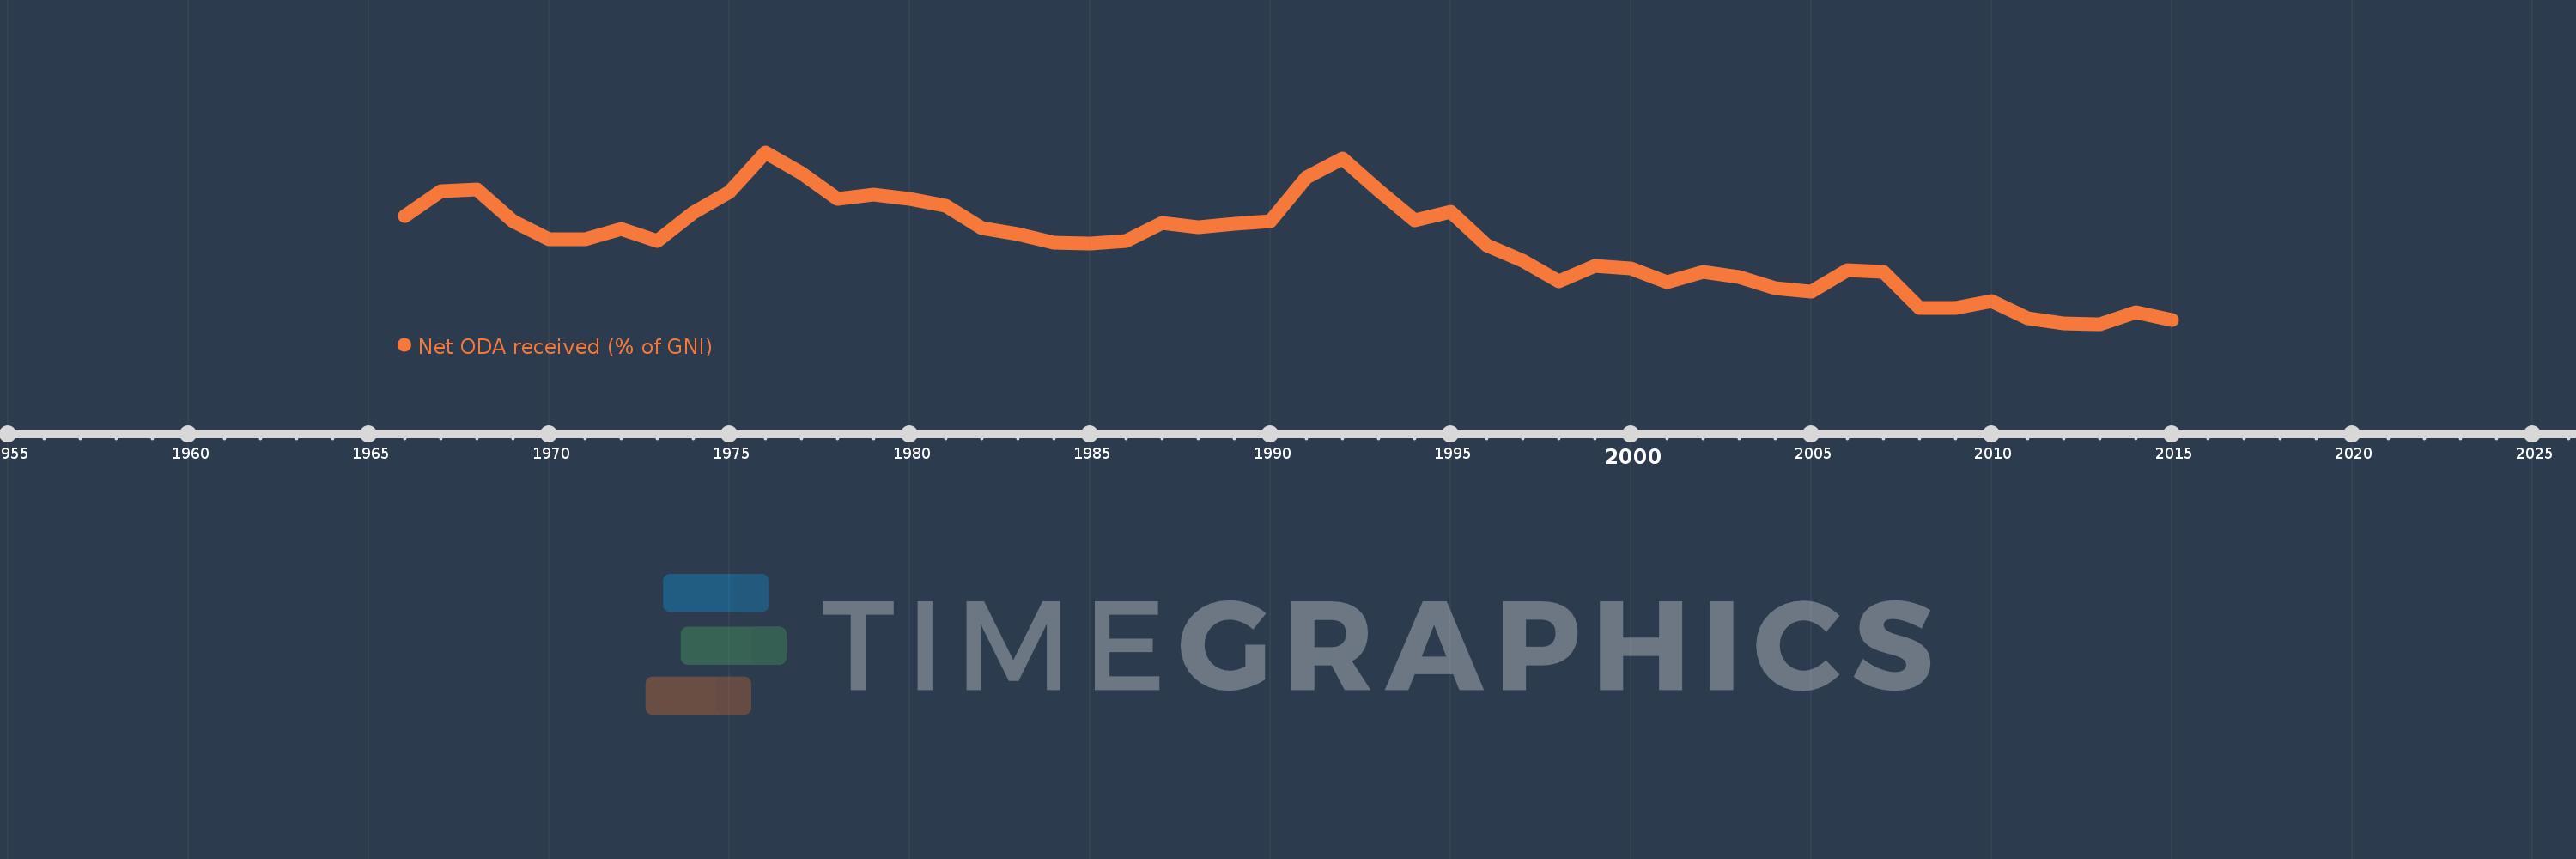
Net ODA received (% of GNI)
2015,2014,2013,2012,2011,2010,2009,2008,2007,2006,2005,2004,2003,2002,2001,2000,1999,1998,1997,1996,1995,1994,1993,1992,1991,1990,1989,1988,1987,1986,1985,1984,1983,1982,1981,1980,1979,1978,1977,1976,1975,1974,1973,1972,1971,1970,1969,1968,1967,1966
Estas estadísticas en otros países:
AfghanistanAlbaniaAlgeriaAngolaAntigua and BarbudaArab WorldArgentinaArmeniaAzerbaijanBahamas, TheBahrainBangladeshBarbadosBelarusBelizeBeninBermudaBhutanBoliviaBosnia and HerzegovinaBotswanaBrazilBrunei DarussalamBurkina FasoBurundiCabo VerdeCambodiaCameroonCaribbean small statesCentral African RepublicCentral Europe and the BalticsChadChileChinaColombiaComorosCongo, Dem. Rep.Congo, Rep.Costa RicaCote d'IvoireCroatiaCubaCyprusDjiboutiDominicaDominican RepublicEast Asia & PacificEast Asia & Pacific (excluding high income)East Asia & Pacific (IDA & IBRD countries)EcuadorEgypt, Arab Rep.El SalvadorEquatorial GuineaEritreaEthiopiaEuro areaEurope & Central AsiaEurope & Central Asia (excluding high income)Europe & Central Asia (IDA & IBRD countries)European UnionFijiFragile and conflict affected situationsFrench PolynesiaGabonGambia, TheGeorgiaGhanaGrenadaGuatemalaGuineaGuinea-BissauGuyanaHaitiHeavily indebted poor countries (HIPC)High incomeHondurasHong Kong SAR, ChinaIBRD onlyIDA & IBRD totalIDA blendIDA onlyIDA totalIndiaIndonesiaIran, Islamic Rep.IraqIsraelJamaicaJordanKazakhstanKenyaKiribatiKorea, Rep.KosovoKuwaitKyrgyz RepublicLao PDRLatin America & Caribbean Latin America & Caribbean (excluding high income)Latin America & the Caribbean (IDA & IBRD countries)Least developed countries: UN classificationLebanonLesothoLiberiaLibyaLow & middle incomeLow incomeLower middle incomeMacao SAR, ChinaMacedonia, FYRMadagascarMalawiMalaysiaMaldivesMaliMaltaMarshall IslandsMauritaniaMauritiusMexicoMicronesia, Fed. Sts.Middle East & North AfricaMiddle East & North Africa (excluding high income)Middle East & North Africa (IDA & IBRD countries)Middle incomeMoldovaMongoliaMontenegroMoroccoMozambiqueMyanmarNamibiaNauruNepalNew CaledoniaNicaraguaNigerNigeriaNorth AmericaOECD membersOmanOther small statesPacific island small statesPakistanPalauPanamaPapua New GuineaParaguayPeruPhilippinesQatarRwandaSamoaSao Tome and PrincipeSaudi ArabiaSenegalSerbiaSeychellesSierra LeoneSingaporeSloveniaSmall statesSolomon IslandsSomaliaSouth AfricaSouth AsiaSouth Asia (IDA & IBRD)South SudanSri LankaSt. Kitts and NevisSt. LuciaSt. Vincent and the GrenadinesSub-Saharan Africa Sub-Saharan Africa (excluding high income)Sub-Saharan Africa (IDA & IBRD countries)SudanSurinameSwazilandSyrian Arab RepublicTajikistanTanzaniaThailandTimor-LesteTogoTongaTrinidad and TobagoTunisiaTurkeyTurkmenistanTuvaluUgandaUkraineUpper middle incomeUruguayUzbekistanVanuatuVenezuela, RBVietnamWest Bank and GazaWorldYemen, Rep.ZambiaZimbabwe línea de tiempo (timeline):
En esta escala de tiempo se presenta un gráfico de 1966 y 2015 de Lower middle income. Los datos de 1965 están ausentes. El número de observaciones reales por fecha: 50.
Fuente (nombre):
Indicadores del desarrollo mundial
Fuente (organización):
Development Assistance Committee of the Organisation for Economic Co-operation and Development, Geographical Distribution of Financial Flows to Developing Countries, Development Co-operation Report, and International Development Statistics database. Data are available online at: www.oecd.org/dac/stats/idsonline. World Bank GNI estimates are used for the denominator.
Categorías:
Aid Effectiveness, Economy & Growth, External Debt
Se ha actualizado:
23 abr 2017 año
Los indicadores de los cambios de valor en los últimos años
Mínimo:
0.804
1 ene 2013 año
Máximo:
3.408
1 ene 1976 año
A la fecha de observación
Valor
Cambio absoluto
El cambio con respecto al valor anterior
1 ene 1966 año
2.447
+2.447
0.0%
1 ene 1967 año
2.827
+0.381
15.55%
1 ene 1968 año
2.847
+0.019
0.68%
1 ene 1969 año
2.365
-0.481
-16.91%
1 ene 1970 año
2.088
-0.277
-11.71%
1 ene 1971 año
2.086
-0.002
-0.11%
1 ene 1972 año
2.247
+0.161
7.73%
1 ene 1973 año
2.072
-0.175
-7.79%
1 ene 1974 año
2.493
+0.421
20.31%
1 ene 1975 año
2.803
+0.31
12.42%
1 ene 1976 año
3.408
+0.606
21.61%
1 ene 1977 año
3.092
-0.317
-9.29%
1 ene 1978 año
2.709
-0.383
-12.38%
1 ene 1979 año
2.764
+0.054
2.01%
1 ene 1980 año
2.703
-0.061
-2.2%
1 ene 1981 año
2.594
-0.108
-4.01%
1 ene 1982 año
2.264
-0.331
-12.75%
1 ene 1983 año
2.175
-0.089
-3.92%
1 ene 1984 año
2.046
-0.129
-5.92%
1 ene 1985 año
2.032
-0.014
-0.69%
1 ene 1986 año
2.066
+0.034
1.67%
1 ene 1987 año
2.343
+0.277
13.42%
1 ene 1988 año
2.269
-0.074
-3.17%
1 ene 1989 año
2.329
+0.06
2.64%
1 ene 1990 año
2.37
+0.041
1.76%
1 ene 1991 año
3.03
+0.66
27.84%
1 ene 1992 año
3.312
+0.282
9.31%
1 ene 1993 año
2.832
-0.479
-14.47%
1 ene 1994 año
2.373
-0.459
-16.2%
1 ene 1995 año
2.507
+0.133
5.61%
1 ene 1996 año
2.002
-0.505
-20.14%
1 ene 1997 año
1.761
-0.24
-12.01%
1 ene 1998 año
1.452
-0.309
-17.57%
1 ene 1999 año
1.693
+0.242
16.65%
1 ene 2000 año
1.648
-0.046
-2.7%
1 ene 2001 año
1.446
-0.201
-12.22%
1 ene 2002 año
1.602
+0.155
10.73%
1 ene 2003 año
1.516
-0.086
-5.36%
1 ene 2004 año
1.345
-0.17
-11.25%
1 ene 2005 año
1.298
-0.047
-3.49%
1 ene 2006 año
1.628
+0.329
25.37%
1 ene 2007 año
1.599
-0.028
-1.75%
1 ene 2008 año
1.048
-0.552
-34.5%
1 ene 2009 año
1.052
+0.004
0.42%
1 ene 2010 año
1.156
+0.104
9.9%
1 ene 2011 año
0.891
-0.265
-22.93%
1 ene 2012 año
0.818
-0.073
-8.18%
1 ene 2013 año
0.804
-0.014
-1.69%
1 ene 2014 año
0.983
+0.179
22.22%
1 ene 2015 año
0.872
-0.111
-11.27%
Ranking de los países por los datos estadísticos actuales


Comentarios: