29
/es/
es
AIzaSyAYiBZKx7MnpbEhh9jyipgxe19OcubqV5w
April 1, 2024
179222
Liberia
LBR
true
2
1
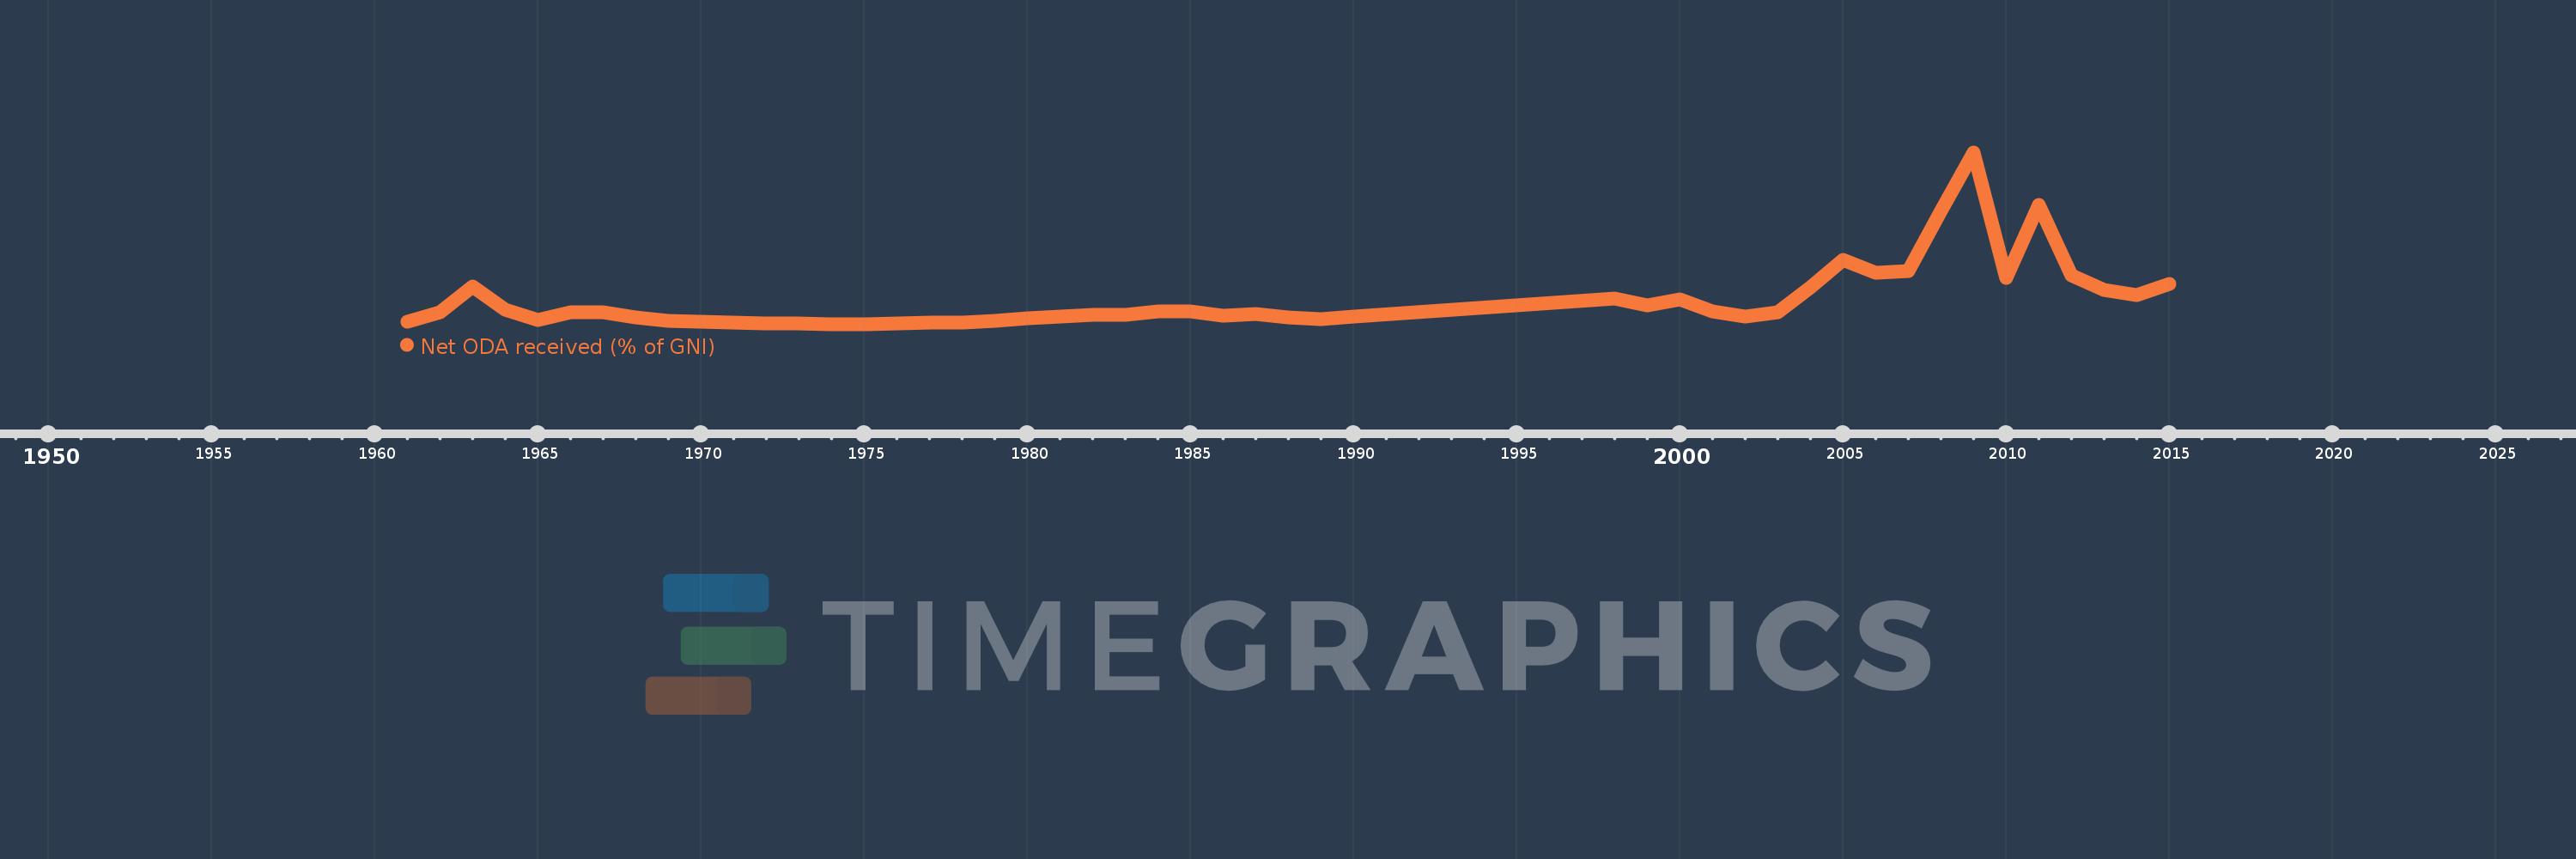
Net ODA received (% of GNI)
2015,2014,2013,2012,2011,2010,2009,2008,2007,2006,2005,2004,2003,2002,2001,2000,1999,1998,1990,1989,1988,1987,1986,1985,1984,1983,1982,1981,1980,1979,1978,1977,1976,1975,1974,1973,1972,1971,1970,1969,1968,1967,1966,1965,1964,1963,1962,1961
Estas estadísticas en otros países:
AfghanistanAlbaniaAlgeriaAngolaAntigua and BarbudaArab WorldArgentinaArmeniaAzerbaijanBahamas, TheBahrainBangladeshBarbadosBelarusBelizeBeninBermudaBhutanBoliviaBosnia and HerzegovinaBotswanaBrazilBrunei DarussalamBurkina FasoBurundiCabo VerdeCambodiaCameroonCaribbean small statesCentral African RepublicCentral Europe and the BalticsChadChileChinaColombiaComorosCongo, Dem. Rep.Congo, Rep.Costa RicaCote d'IvoireCroatiaCubaCyprusDjiboutiDominicaDominican RepublicEast Asia & PacificEast Asia & Pacific (excluding high income)East Asia & Pacific (IDA & IBRD countries)EcuadorEgypt, Arab Rep.El SalvadorEquatorial GuineaEritreaEthiopiaEuro areaEurope & Central AsiaEurope & Central Asia (excluding high income)Europe & Central Asia (IDA & IBRD countries)European UnionFijiFragile and conflict affected situationsFrench PolynesiaGabonGambia, TheGeorgiaGhanaGrenadaGuatemalaGuineaGuinea-BissauGuyanaHaitiHeavily indebted poor countries (HIPC)High incomeHondurasHong Kong SAR, ChinaIBRD onlyIDA & IBRD totalIDA blendIDA onlyIDA totalIndiaIndonesiaIran, Islamic Rep.IraqIsraelJamaicaJordanKazakhstanKenyaKiribatiKorea, Rep.KosovoKuwaitKyrgyz RepublicLao PDRLatin America & Caribbean Latin America & Caribbean (excluding high income)Latin America & the Caribbean (IDA & IBRD countries)Least developed countries: UN classificationLebanonLesothoLiberiaLibyaLow & middle incomeLow incomeLower middle incomeMacao SAR, ChinaMacedonia, FYRMadagascarMalawiMalaysiaMaldivesMaliMaltaMarshall IslandsMauritaniaMauritiusMexicoMicronesia, Fed. Sts.Middle East & North AfricaMiddle East & North Africa (excluding high income)Middle East & North Africa (IDA & IBRD countries)Middle incomeMoldovaMongoliaMontenegroMoroccoMozambiqueMyanmarNamibiaNauruNepalNew CaledoniaNicaraguaNigerNigeriaNorth AmericaOECD membersOmanOther small statesPacific island small statesPakistanPalauPanamaPapua New GuineaParaguayPeruPhilippinesQatarRwandaSamoaSao Tome and PrincipeSaudi ArabiaSenegalSerbiaSeychellesSierra LeoneSingaporeSloveniaSmall statesSolomon IslandsSomaliaSouth AfricaSouth AsiaSouth Asia (IDA & IBRD)South SudanSri LankaSt. Kitts and NevisSt. LuciaSt. Vincent and the GrenadinesSub-Saharan Africa Sub-Saharan Africa (excluding high income)Sub-Saharan Africa (IDA & IBRD countries)SudanSurinameSwazilandSyrian Arab RepublicTajikistanTanzaniaThailandTimor-LesteTogoTongaTrinidad and TobagoTunisiaTurkeyTurkmenistanTuvaluUgandaUkraineUpper middle incomeUruguayUzbekistanVanuatuVenezuela, RBVietnamWest Bank and GazaWorldYemen, Rep.ZambiaZimbabwe línea de tiempo (timeline):
En esta escala de tiempo se presenta un gráfico de 1961 y 2015 de Liberia. Los datos de 1960 están ausentes. El número de observaciones reales por fecha: 48.
Fuente (nombre):
Indicadores del desarrollo mundial
Fuente (organización):
Development Assistance Committee of the Organisation for Economic Co-operation and Development, Geographical Distribution of Financial Flows to Developing Countries, Development Co-operation Report, and International Development Statistics database. Data are available online at: www.oecd.org/dac/stats/idsonline. World Bank GNI estimates are used for the denominator.
Categorías:
Aid Effectiveness, Economy & Growth, External Debt
Se ha actualizado:
23 abr 2017 año
Los indicadores de los cambios de valor en los últimos años
Mínimo:
2.474
1 ene 1974 año
Máximo:
181.187
1 ene 2009 año
A la fecha de observación
Valor
Cambio absoluto
El cambio con respecto al valor anterior
1 ene 1961 año
5.294
+5.294
0.0%
1 ene 1962 año
14.812
+9.517
179.76%
1 ene 1963 año
41.787
+26.976
182.13%
1 ene 1964 año
17.268
-24.519
-58.68%
1 ene 1965 año
6.798
-10.47
-60.64%
1 ene 1966 año
14.487
+7.69
113.13%
1 ene 1967 año
14.708
+0.221
1.52%
1 ene 1968 año
9.285
-5.423
-36.87%
1 ene 1969 año
5.542
-3.744
-40.32%
1 ene 1970 año
5.039
-0.503
-9.07%
1 ene 1971 año
3.762
-1.277
-25.34%
1 ene 1972 año
3.526
-0.236
-6.27%
1 ene 1973 año
3.279
-0.247
-7.01%
1 ene 1974 año
2.474
-0.805
-24.55%
1 ene 1975 año
2.779
+0.305
12.32%
1 ene 1976 año
3.254
+0.475
17.1%
1 ene 1977 año
4.097
+0.843
25.9%
1 ene 1978 año
4.416
+0.319
7.8%
1 ene 1979 año
5.858
+1.442
32.65%
1 ene 1980 año
8.952
+3.094
52.82%
1 ene 1981 año
10.44
+1.488
16.62%
1 ene 1982 año
11.839
+1.399
13.4%
1 ene 1983 año
12.228
+0.39
3.29%
1 ene 1984 año
15.478
+3.25
26.58%
1 ene 1985 año
16.166
+0.688
4.45%
1 ene 1986 año
11.204
-4.963
-30.7%
1 ene 1987 año
12.995
+1.791
15.98%
1 ene 1988 año
9.89
-3.105
-23.89%
1 ene 1989 año
7.604
-2.285
-23.11%
1 ene 1990 año
10.24
+2.636
34.66%
1 ene 1998 año
28.812
+18.572
181.37%
1 ene 1999 año
22.434
-6.379
-22.14%
1 ene 2000 año
28.095
+5.661
25.24%
1 ene 2001 año
15.765
-12.33
-43.89%
1 ene 2002 año
10.557
-5.208
-33.03%
1 ene 2003 año
14.546
+3.989
37.79%
1 ene 2004 año
40.646
+26.1
179.42%
1 ene 2005 año
69.147
+28.501
70.12%
1 ene 2006 año
56.412
-12.735
-18.42%
1 ene 2007 año
57.618
+1.206
2.14%
1 ene 2008 año
119.931
+62.313
108.15%
1 ene 2009 año
181.187
+61.256
51.08%
1 ene 2010 año
50.722
-130.465
-72.01%
1 ene 2011 año
126.901
+76.179
150.19%
1 ene 2012 año
53.571
-73.331
-57.79%
1 ene 2013 año
38.402
-15.168
-28.31%
1 ene 2014 año
32.528
-5.875
-15.3%
1 ene 2015 año
44.305
+11.778
36.21%
Ranking de los países por los datos estadísticos actuales


Comentarios: