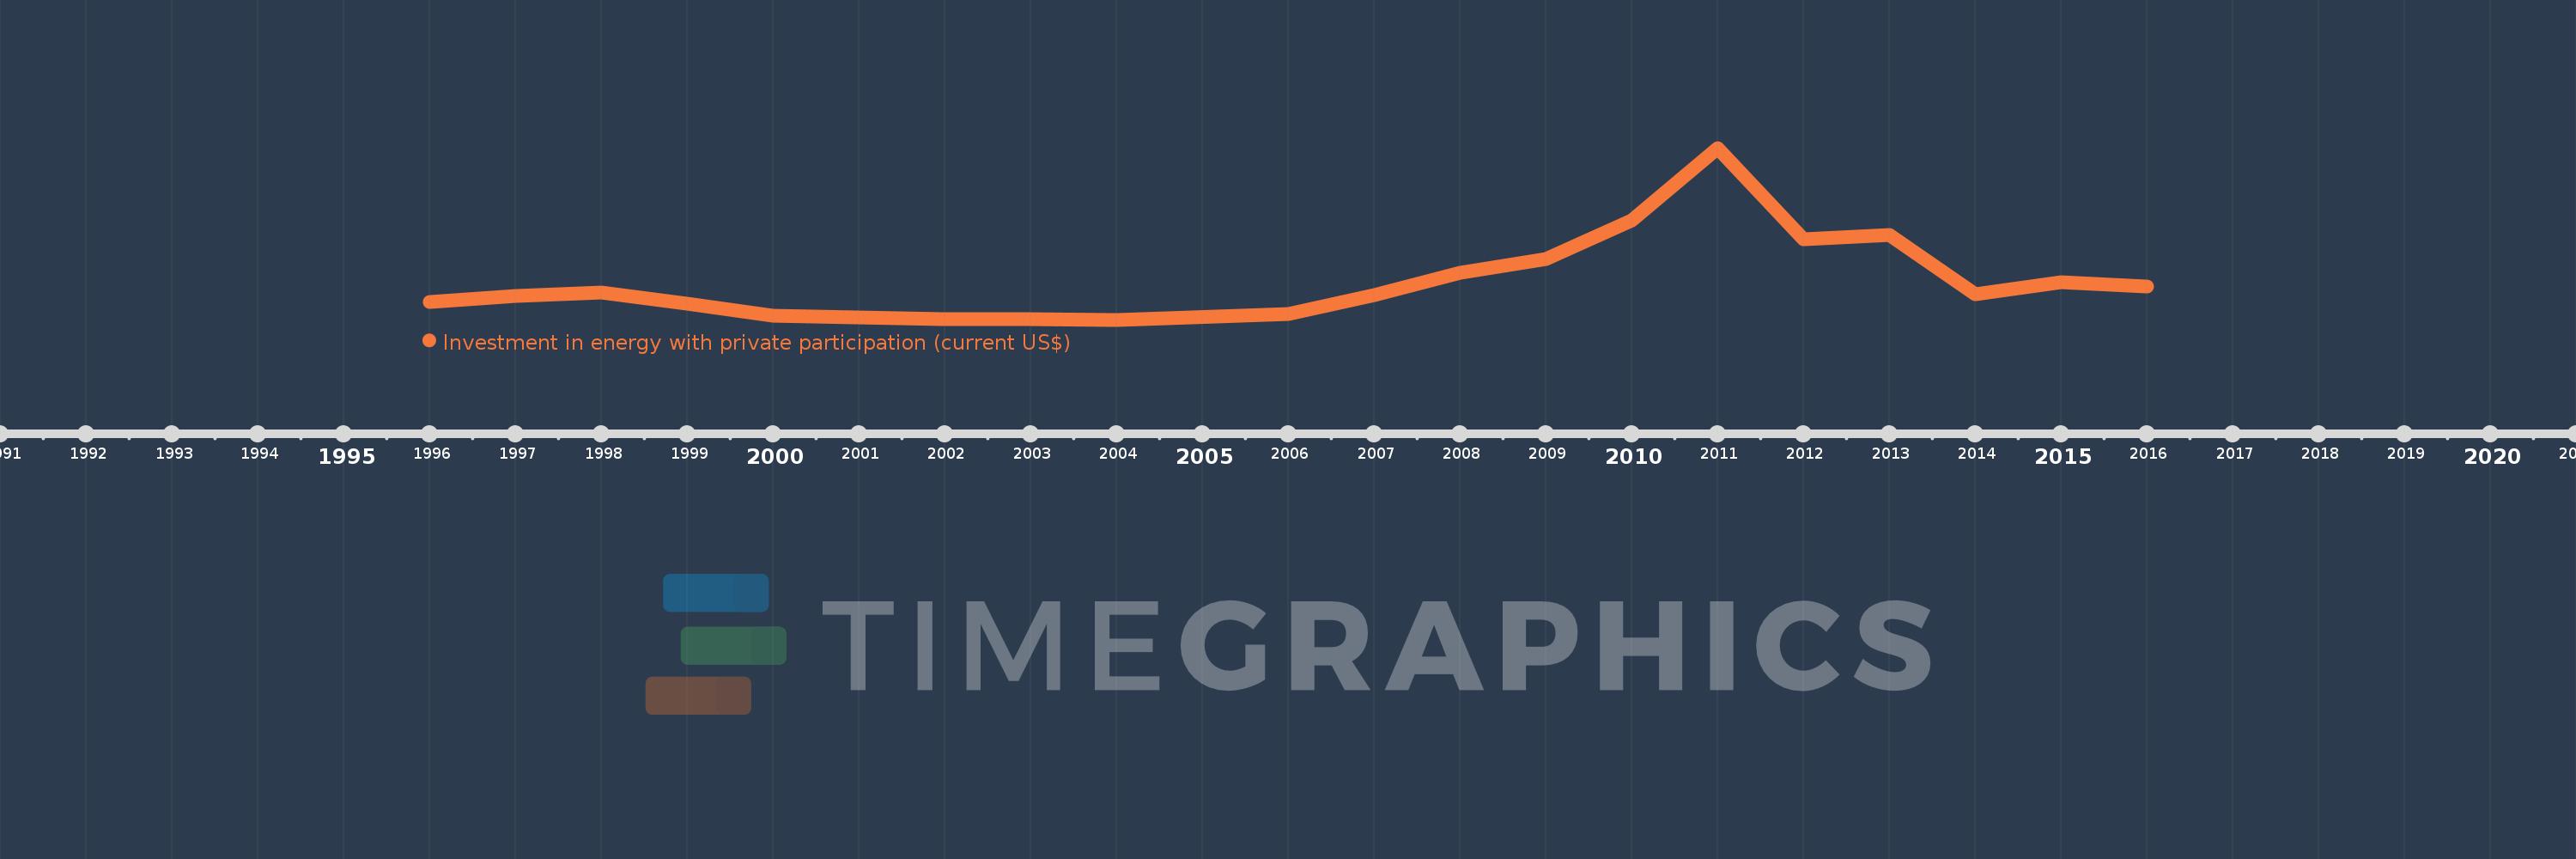
En esta escala de tiempo se presenta un gráfico de 1996 y 2016 de Lower middle income. Los datos de 1995 están ausentes. El número de observaciones reales por fecha: 19.
Fuente (nombre):
Indicadores del desarrollo mundial
Fuente (organización):
World Bank, Private Participation in Infrastructure Project Database (http://ppi.worldbank.org).
Categorías:
Energy & Mining, Infrastructure, Private Sector
Se ha actualizado:
23 abr 2017 año
Los indicadores de los cambios de valor en los últimos años
En promedio:
14.854 bn
Mínimo:
3.317 bn
1 ene 2004 año
Máximo:
52.698 bn
1 ene 2011 año
A la fecha de observación
Valor
Cambio absoluto
El cambio con respecto al valor anterior
1 ene 1996 año
8.473 bn
+8.473 bn
0.0%
1 ene 1997 año
10.255 bn
+1.782 bn
21.04%
1 ene 1998 año
11.105 bn
+850.3 millones
8.29%
1 ene 1999 año
7.959 bn
-3.146 bn
-28.33%
1 ene 2000 año
4.596 bn
-3.363 bn
-42.25%
1 ene 2002 año
3.474 bn
-1.122 bn
-24.42%
1 ene 2003 año
3.547 bn
+72.37 millones
2.08%
1 ene 2004 año
3.317 bn
-229.42 millones
-6.47%
1 ene 2006 año
4.902 bn
+1.585 bn
47.77%
1 ene 2007 año
10.31 bn
+5.408 bn
110.33%
1 ene 2008 año
16.923 bn
+6.613 bn
64.14%
1 ene 2009 año
20.719 bn
+3.796 bn
22.43%
1 ene 2010 año
32.002 bn
+11.283 bn
54.45%
1 ene 2011 año
52.698 bn
+20.696 bn
64.67%
1 ene 2012 año
26.37 bn
-26.328 bn
-49.96%
1 ene 2013 año
27.806 bn
+1.436 bn
5.45%
1 ene 2014 año
10.699 bn
-17.108 bn
-61.52%
1 ene 2015 año
14.136 bn
+3.437 bn
32.13%
1 ene 2016 año
12.934 bn
-1.203 bn
-8.51%
Ranking de los países por los datos estadísticos actuales
