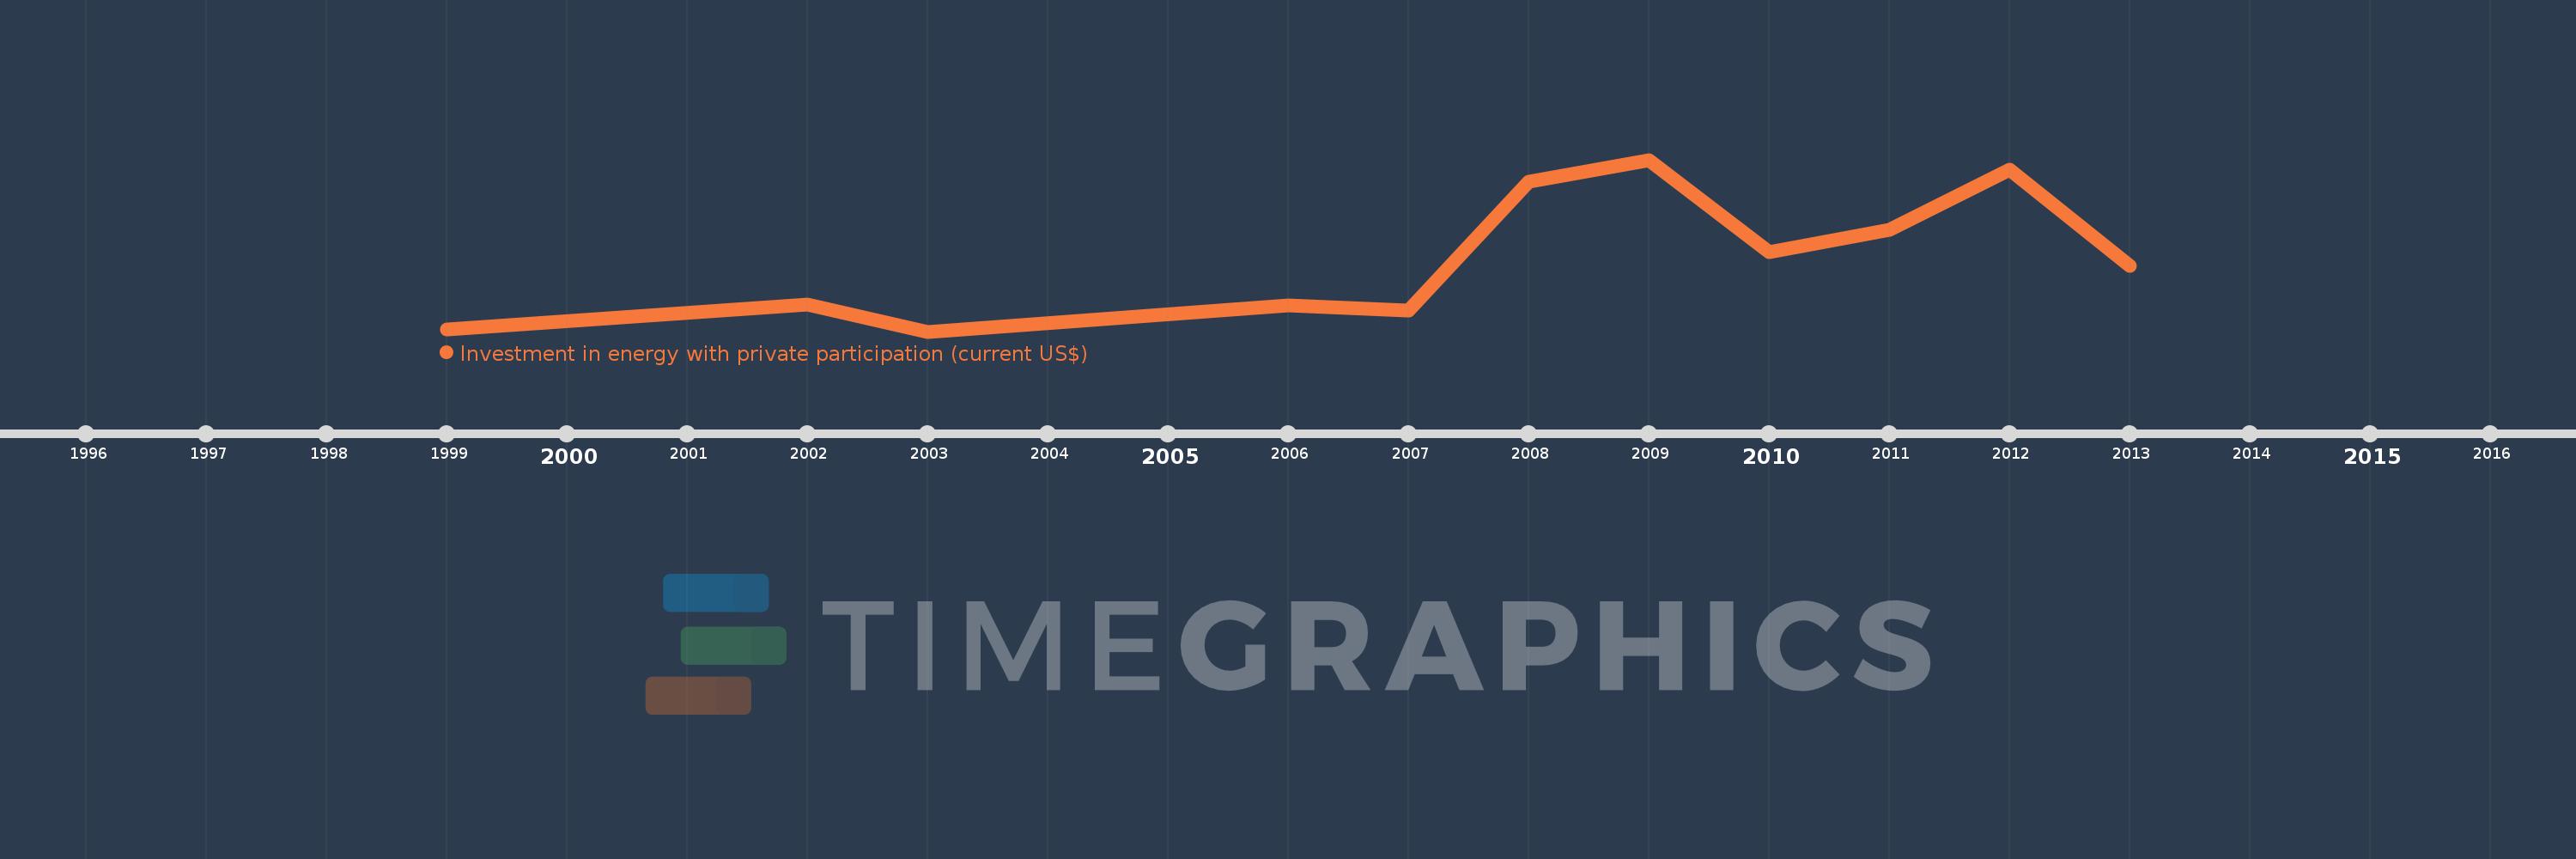
En esta escala de tiempo se presenta un gráfico de 1999 y 2013 de Europe & Central Asia (excluding high income). Los datos de 1998 están ausentes. El número de observaciones reales por fecha: 11.
Fuente (nombre):
Indicadores del desarrollo mundial
Fuente (organización):
World Bank, Private Participation in Infrastructure Project Database (http://ppi.worldbank.org).
Categorías:
Energy & Mining, Infrastructure, Private Sector
Se ha actualizado:
23 abr 2017 año
Los indicadores de los cambios de valor en los últimos años
En promedio:
9.201 bn
Mínimo:
612.2 millones
1 ene 2003 año
Máximo:
20.747 bn
1 ene 2009 año
A la fecha de observación
Valor
Cambio absoluto
El cambio con respecto al valor anterior
1 ene 1999 año
879.0 millones
+879.0 millones
0.0%
1 ene 2002 año
3.79 bn
+2.911 bn
331.17%
1 ene 2003 año
612.2 millones
-3.178 bn
-83.85%
1 ene 2006 año
3.647 bn
+3.034 bn
495.66%
1 ene 2007 año
3.096 bn
-551.1 millones
-15.11%
1 ene 2008 año
18.169 bn
+15.074 bn
486.95%
1 ene 2009 año
20.747 bn
+2.578 bn
14.19%
1 ene 2010 año
9.881 bn
-10.866 bn
-52.37%
1 ene 2011 año
12.504 bn
+2.623 bn
26.54%
1 ene 2012 año
19.614 bn
+7.11 bn
56.86%
1 ene 2013 año
8.274 bn
-11.34 bn
-57.82%
Ranking de los países por los datos estadísticos actuales
